\n
## Chart: gsSNR Gain vs. TotERITF
### Overview
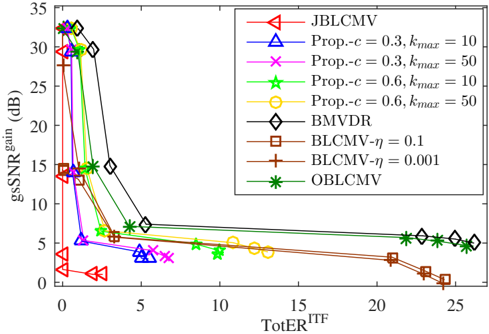
The image presents a line chart illustrating the relationship between gsSNR gain (in dB) and TotERITF. The chart compares the performance of several different algorithms or methods, indicated by different colored lines. The general trend shows a rapid decrease in gsSNR gain as TotERITF increases, with varying rates of decline for each method.
### Components/Axes
* **X-axis:** Labeled "TotERITF", ranging from approximately 0 to 25.
* **Y-axis:** Labeled "gsSNR gain (dB)", ranging from approximately 0 to 35.
* **Legend:** Located in the top-right corner of the chart. It identifies the following methods/algorithms with corresponding colors and markers:
* JBLCMV (Red Triangles)
* Prop.-c = 0.3, kmax = 10 (Blue Triangles)
* Prop.-c = 0.3, kmax = 50 (Magenta Crosses)
* Prop.-c = 0.6, kmax = 10 (Green Stars)
* Prop.-c = 0.6, kmax = 50 (Yellow Circles)
* BMVDR (Black Diamonds)
* BLCMV-η = 0.1 (Brown Squares)
* BLCMV-η = 0.001 (Orange Plus Signs)
* OBLCMV (Dark Green Hexagons)
### Detailed Analysis
Here's a breakdown of each line's trend and approximate data points, verified against the legend colors:
* **JBLCMV (Red Triangles):** Starts at approximately 32 dB at TotERITF = 0, rapidly decreasing to around 2 dB at TotERITF = 5, and then leveling off to approximately 1 dB at TotERITF = 25.
* **Prop.-c = 0.3, kmax = 10 (Blue Triangles):** Starts at approximately 31 dB at TotERITF = 0, decreases to around 3 dB at TotERITF = 5, and then stabilizes around 2 dB at TotERITF = 25.
* **Prop.-c = 0.3, kmax = 50 (Magenta Crosses):** Starts at approximately 30 dB at TotERITF = 0, decreases to around 4 dB at TotERITF = 5, and then stabilizes around 2 dB at TotERITF = 25.
* **Prop.-c = 0.6, kmax = 10 (Green Stars):** Starts at approximately 28 dB at TotERITF = 0, decreases to around 6 dB at TotERITF = 5, and then stabilizes around 4 dB at TotERITF = 25.
* **Prop.-c = 0.6, kmax = 50 (Yellow Circles):** Starts at approximately 26 dB at TotERITF = 0, decreases to around 5 dB at TotERITF = 5, and then stabilizes around 3 dB at TotERITF = 25.
* **BMVDR (Black Diamonds):** Starts at approximately 24 dB at TotERITF = 0, decreases to around 10 dB at TotERITF = 5, and then stabilizes around 5 dB at TotERITF = 25.
* **BLCMV-η = 0.1 (Brown Squares):** Starts at approximately 16 dB at TotERITF = 0, decreases to around 4 dB at TotERITF = 5, and then stabilizes around 1 dB at TotERITF = 25.
* **BLCMV-η = 0.001 (Orange Plus Signs):** Starts at approximately 14 dB at TotERITF = 0, decreases to around 0 dB at TotERITF = 5, and remains near 0 dB for the rest of the range.
* **OBLCMV (Dark Green Hexagons):** Starts at approximately 22 dB at TotERITF = 0, decreases to around 8 dB at TotERITF = 5, and then stabilizes around 4 dB at TotERITF = 25.
### Key Observations
* All methods exhibit a significant drop in gsSNR gain as TotERITF increases.
* JBLCMV, Prop.-c = 0.3, kmax = 10, and Prop.-c = 0.3, kmax = 50 initially provide the highest gsSNR gains.
* BLCMV-η = 0.001 performs the worst, with a very low gsSNR gain across all TotERITF values.
* The rate of decline in gsSNR gain appears to slow down as TotERITF increases beyond 5.
* The methods with higher 'kmax' values (kmax = 50) generally show slightly better performance than those with lower 'kmax' values (kmax = 10) for the Prop.-c methods.
### Interpretation
This chart demonstrates the performance trade-offs of different algorithms in the context of increasing TotERITF. TotERITF likely represents some form of interference or complexity in the environment. The gsSNR gain represents the signal-to-noise ratio improvement achieved by the algorithm.
The rapid initial decline in gsSNR gain suggests that these algorithms are effective at mitigating interference at low TotERITF levels, but their performance degrades as the interference becomes more severe. The leveling off of the curves at higher TotERITF values indicates a saturation point, where the algorithms can no longer significantly improve the signal-to-noise ratio.
The differences in performance between the algorithms suggest that some are more robust to interference than others. The parameters 'c', 'kmax', and 'η' likely control the algorithm's behavior and influence its ability to handle interference. The fact that BLCMV-η = 0.001 performs so poorly suggests that a very small value of η is detrimental to the algorithm's performance.
The chart provides valuable insights for selecting the most appropriate algorithm for a given application, based on the expected level of interference. Further investigation would be needed to understand the specific meaning of TotERITF and the parameters used in each algorithm.