## Line Graph: gssSNR Gain vs. TotER_ITF
### Overview
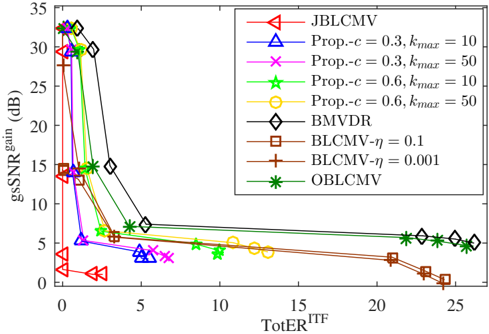
The graph compares the gssSNR gain (in dB) across different configurations or methods as a function of TotER_ITF (x-axis). The y-axis ranges from 0 to 35 dB, while the x-axis spans 0 to 25. Multiple data series are plotted with distinct symbols and colors, each representing a unique configuration or algorithm.
### Components/Axes
- **Y-Axis**: Labeled "gssSNR gain (dB)" with a linear scale from 0 to 35.
- **X-Axis**: Labeled "TotER_ITF" with a linear scale from 0 to 25.
- **Legend**: Located in the top-right corner, mapping symbols/colors to configurations:
- **Red triangles**: JBLCMV
- **Blue triangles**: Prop.-c = 0.3, k_max = 10
- **Purple crosses**: Prop.-c = 0.3, k_max = 50
- **Green stars**: Prop.-c = 0.6, k_max = 10
- **Yellow circles**: Prop.-c = 0.6, k_max = 50
- **Black diamonds**: BMVDR
- **Brown squares**: BLCMV-η = 0.1
- **Brown crosses**: BLCMV-η = 0.001
- **Green asterisks**: OBLCMV
### Detailed Analysis
1. **JBLCMV (Red Triangles)**:
- Starts at ~30 dB at TotER_ITF = 0.
- Drops sharply to ~0 dB by TotER_ITF = 25.
- Steepest decline among all series.
2. **Prop.-c = 0.3 Configurations**:
- **k_max = 10 (Blue Triangles)**: Begins at ~28 dB, declines to ~5 dB by TotER_ITF = 25.
- **k_max = 50 (Purple Crosses)**: Starts at ~26 dB, drops to ~3 dB by TotER_ITF = 25.
- Higher k_max values result in slower SNR gain degradation.
3. **Prop.-c = 0.6 Configurations**:
- **k_max = 10 (Green Stars)**: Starts at ~24 dB, declines to ~4 dB by TotER_ITF = 25.
- **k_max = 50 (Yellow Circles)**: Begins at ~22 dB, drops to ~2 dB by TotER_ITF = 25.
- Higher k_max values again show slower degradation.
4. **BMVDR (Black Diamonds)**:
- Starts at ~25 dB, declines to ~5 dB by TotER_ITF = 25.
- Moderate decline rate, outperforming JBLCMV but underperforming Prop.-c = 0.6 configurations.
5. **BLCMV Configurations**:
- **η = 0.1 (Brown Squares)**: Starts at ~20 dB, declines to ~3 dB by TotER_ITF = 25.
- **η = 0.001 (Brown Crosses)**: Begins at ~18 dB, drops to ~2 dB by TotER_ITF = 25.
- Lower η values result in slightly better performance.
6. **OBLCMV (Green Asterisks)**:
- Starts at ~20 dB, declines to ~2 dB by TotER_ITF = 25.
- Gradual decline, maintaining higher SNR gain longer than most series.
### Key Observations
- **Steepest Decline**: JBLCMV (red triangles) loses SNR gain most rapidly.
- **Slowest Decline**: Prop.-c = 0.6, k_max = 50 (yellow circles) and OBLCMV (green asterisks) retain SNR gain longest.
- **η Sensitivity**: BLCMV-η = 0.001 (brown crosses) underperforms BLCMV-η = 0.1 (brown squares), suggesting η impacts robustness.
- **Consistency**: All configurations show monotonic decline, but rates vary significantly.
### Interpretation
The graph demonstrates that SNR gain degrades as TotER_ITF increases, with performance heavily dependent on configuration parameters:
- **Higher k_max values** (e.g., 50 vs. 10) improve resilience to TotER_ITF, as seen in Prop.-c and BLCMV series.
- **Lower η values** in BLCMV configurations enhance performance, indicating η is a critical tuning parameter.
- **OBLCMV** (green asterisks) exhibits the most gradual decline, suggesting it is optimized for environments with higher TotER_ITF.
- **JBLCMV** (red triangles) is the least robust, likely due to its design constraints.
This analysis highlights trade-offs between configuration parameters and system robustness, guiding optimization for specific operational conditions.