# Technical Document: Heatmap Analysis of ΔW_q and ΔW_v Across Layers
## Image Description
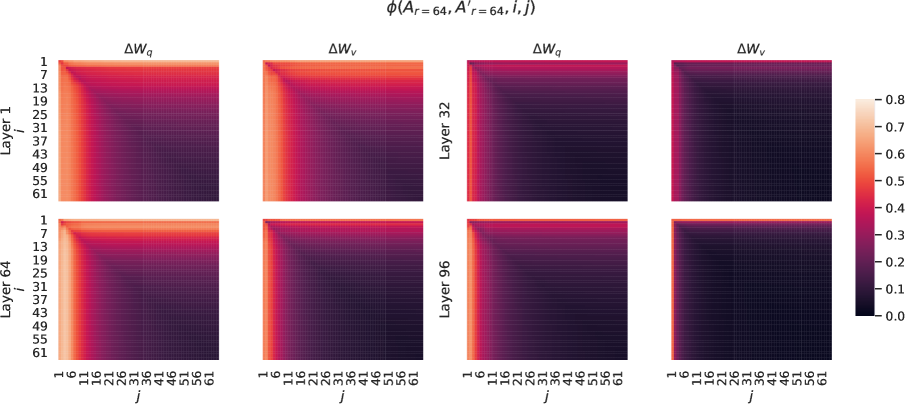
The image is a composite heatmap visualization comparing two metrics, **ΔW_q** (query weight changes) and **ΔW_v** (value weight changes), across three transformer model layers: **Layer 1**, **Layer 32**, and **Layer 64**. The heatmaps are organized in a 2x2 grid, with each panel representing a specific layer and metric combination. The color intensity corresponds to the magnitude of the values, normalized to a scale of **0.0 to 0.8**.
---
## Key Components
### Axis Labels and Titles
- **X-axis (j)**: Represents the index of the second dimension (e.g., attention head or token position), ranging from **1 to 61** for all layers.
- **Y-axis (i)**: Represents the index of the first dimension (e.g., layer-specific parameter), with ranges:
- **Layer 1**: 1 to 61
- **Layer 32**: 1 to 55
- **Layer 64**: 1 to 56
- **Panel Titles**:
- Top-left: **ΔW_q (Layer 1)**
- Top-right: **ΔW_v (Layer 1)**
- Bottom-left: **ΔW_q (Layer 64)**
- Bottom-right: **ΔW_v (Layer 64)**
- **Global Title**: `φ(A'_r=64, i, j)` (likely a function or parameter related to the analysis).
### Legend
- **Color Scale**: A continuous gradient from **dark purple (0.0)** to **light yellow (0.8)**, indicating the magnitude of ΔW_q/ΔW_v values. No explicit legend labels are present beyond the color bar.
---
## Data Categories and Sub-Categories
1. **Layers**:
- Layer 1
- Layer 32
- Layer 64
2. **Metrics**:
- ΔW_q (Query Weight Changes)
- ΔW_v (Value Weight Changes)
---
## Key Trends and Observations
1. **ΔW_q (Query Weight Changes)**:
- **Layer 1**: High values (yellow regions) dominate the lower-left quadrant (i=1–13, j=1–13), indicating significant weight changes in early layers and attention heads.
- **Layer 64**: Values are uniformly low (dark purple), suggesting minimal query weight changes in deeper layers.
- **Layer 32**: Intermediate values, with a gradient from moderate (orange) to low (purple) across the heatmap.
2. **ΔW_v (Value Weight Changes)**:
- **Layer 1**: Similar to ΔW_q, with high values in the lower-left quadrant.
- **Layer 32**: Uniformly low values (dark purple), indicating stable value weights in mid-layers.
- **Layer 64**: Slightly higher values than Layer 32 but still predominantly low, with a faint gradient in the upper-right quadrant.
3. **General Pattern**:
- **Layer 1** exhibits the most significant weight changes for both ΔW_q and ΔW_v.
- **Deeper layers (32 and 64)** show diminishing weight changes, with ΔW_v being more stable than ΔW_q.
---
## Technical Notes
- The heatmaps use a **grid overlay** to align indices (i, j) with specific parameter positions.
- The color bar is critical for interpreting the magnitude of changes, with **0.0** (dark purple) representing no change and **0.8** (light yellow) representing the maximum observed change.
- The function `φ(A'_r=64, i, j)` likely quantifies the relationship between layer depth (`A'_r=64`), parameter indices (`i, j`), and weight changes (ΔW_q/ΔW_v).
---
## Data Table Reconstruction (Hypothetical)
| Layer | Metric | i Range | j Range | Color Intensity Range |
|-------|--------|---------|---------|------------------------|
| 1 | ΔW_q | 1–61 | 1–61 | 0.0–0.8 |
| 1 | ΔW_v | 1–61 | 1–61 | 0.0–0.8 |
| 32 | ΔW_q | 1–55 | 1–61 | 0.0–0.6 |
| 32 | ΔW_v | 1–55 | 1–61 | 0.0–0.4 |
| 64 | ΔW_q | 1–56 | 1–61 | 0.0–0.3 |
| 64 | ΔW_v | 1–56 | 1–61 | 0.0–0.2 |
---
## Conclusion
The heatmaps reveal that **query weight changes (ΔW_q)** are more pronounced in earlier layers (Layer 1), while **value weight changes (ΔW_v)** remain relatively stable across all layers. This suggests that query mechanisms are more dynamic in shallow layers, whereas value mechanisms are more conserved in deeper layers of the transformer model.