## Histogram: Price and Duration Distributions of Claude 3.5 Sonnet
### Overview
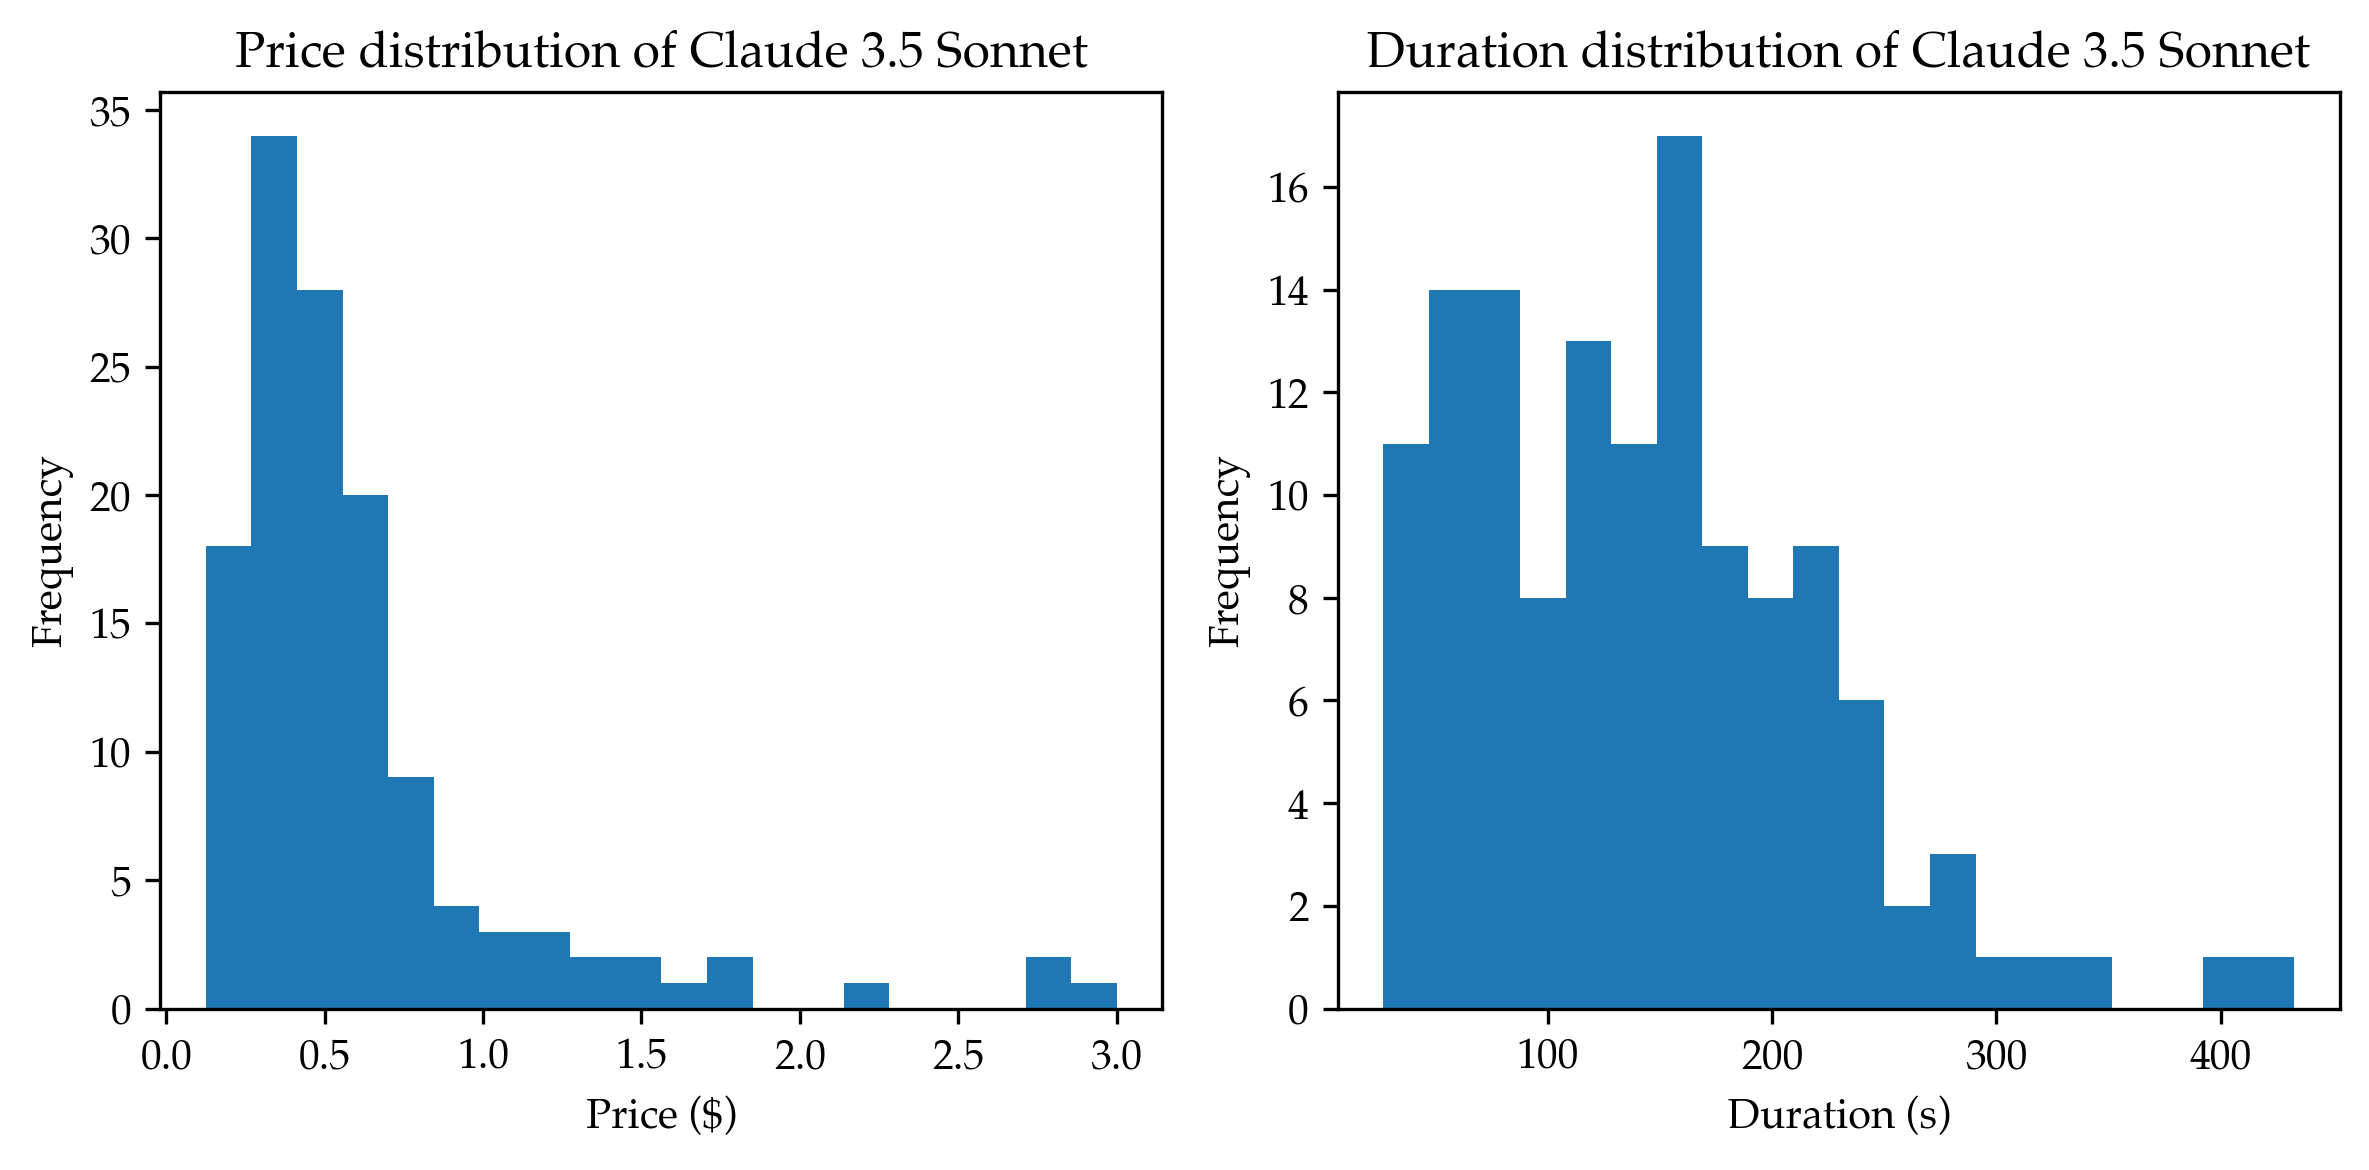
The image presents two histograms side-by-side. The left histogram displays the price distribution of "Claude 3.5 Sonnet," while the right histogram shows the duration distribution of the same entity. Both histograms use frequency on the y-axis and price (in dollars) or duration (in seconds) on the x-axis.
### Components/Axes
**Left Histogram (Price Distribution):**
* **Title:** Price distribution of Claude 3.5 Sonnet
* **X-axis:** Price ($)
* Scale: 0.0 to 3.0, incrementing by 0.5
* **Y-axis:** Frequency
* Scale: 0 to 35, incrementing by 5
* **Bars:** The histogram bars are blue.
**Right Histogram (Duration Distribution):**
* **Title:** Duration distribution of Claude 3.5 Sonnet
* **X-axis:** Duration (s)
* Scale: 0 to 400, incrementing by 100
* **Y-axis:** Frequency
* Scale: 0 to 16, incrementing by 2
* **Bars:** The histogram bars are blue.
### Detailed Analysis
**Left Histogram (Price Distribution):**
The price distribution is heavily skewed to the right.
* **0.0 - 0.25:** Frequency is approximately 18.
* **0.25 - 0.5:** Frequency is approximately 34.
* **0.5 - 0.75:** Frequency is approximately 28.
* **0.75 - 1.0:** Frequency is approximately 20.
* **1.0 - 1.25:** Frequency is approximately 9.
* **1.25 - 1.5:** Frequency is approximately 4.
* **1.5 - 1.75:** Frequency is approximately 3.
* **1.75 - 2.0:** Frequency is approximately 2.
* **2.0 - 2.25:** Frequency is approximately 2.
* **2.5 - 2.75:** Frequency is approximately 1.
* **2.75 - 3.0:** Frequency is approximately 2.
**Right Histogram (Duration Distribution):**
The duration distribution is also skewed to the right, but less dramatically than the price distribution.
* **0 - 50:** Frequency is approximately 11.
* **50 - 100:** Frequency is approximately 14.
* **100 - 150:** Frequency is approximately 8.
* **150 - 200:** Frequency is approximately 13.
* **200 - 250:** Frequency is approximately 17.
* **250 - 300:** Frequency is approximately 9.
* **300 - 350:** Frequency is approximately 6.
* **350 - 400:** Frequency is approximately 3.
* **400 - 450:** Frequency is approximately 1.
### Key Observations
* The price distribution shows that most instances of "Claude 3.5 Sonnet" have a low price, with the frequency decreasing as the price increases.
* The duration distribution shows a peak around 200-250 seconds, with fewer instances at both shorter and longer durations.
### Interpretation
The histograms provide insights into the characteristics of "Claude 3.5 Sonnet." The price distribution suggests that it is generally an inexpensive entity, with a high concentration of instances at lower price points. The duration distribution indicates that it typically has a duration of around 200-250 seconds, with fewer instances having significantly shorter or longer durations. The skewness in both distributions suggests that there are outliers with higher prices and longer durations, but they are relatively rare.