\n
## Histograms: Claude 3.5 Sonnet Price and Duration Distributions
### Overview
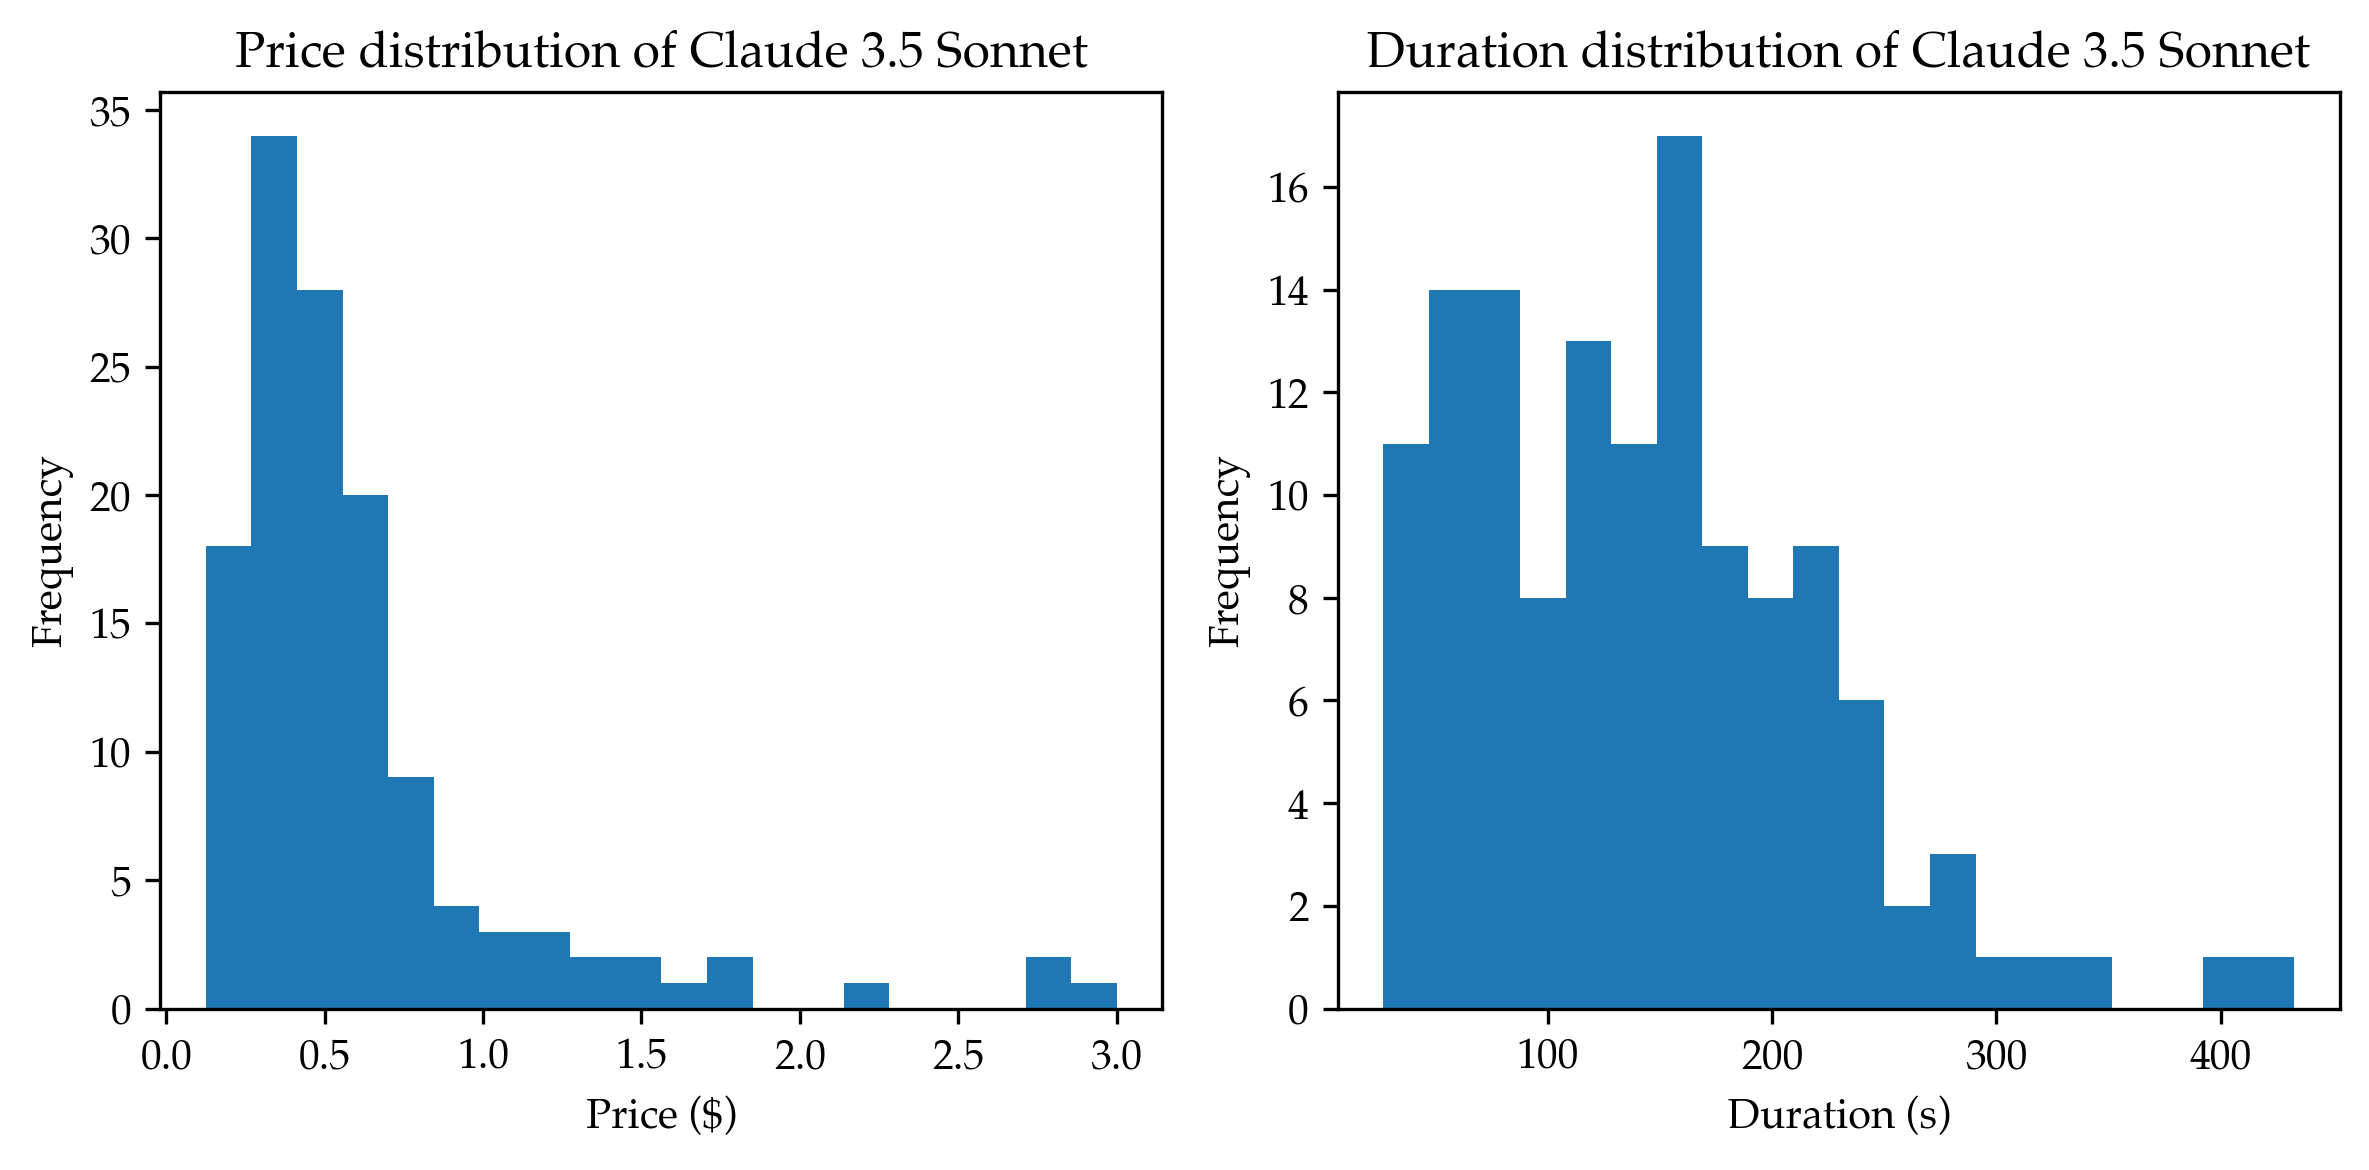
The image presents two histograms displayed side-by-side. The left histogram shows the price distribution of Claude 3.5 Sonnet, while the right histogram shows its duration distribution. Both histograms use frequency as the y-axis and represent the distribution of values for the respective metrics.
### Components/Axes
**Left Histogram (Price Distribution):**
* **Title:** "Price distribution of Claude 3.5 Sonnet"
* **X-axis Label:** "Price ($)"
* **Y-axis Label:** "Frequency"
* **X-axis Scale:** Ranges from approximately 0.0 to 3.0, with increments of 0.5.
* **Y-axis Scale:** Ranges from 0 to 35, with increments of 5.
**Right Histogram (Duration Distribution):**
* **Title:** "Duration distribution of Claude 3.5 Sonnet"
* **X-axis Label:** "Duration (s)"
* **Y-axis Label:** "Frequency"
* **X-axis Scale:** Ranges from approximately 0 to 400, with increments of 100.
* **Y-axis Scale:** Ranges from 0 to 16, with increments of 2.
### Detailed Analysis or Content Details
**Left Histogram (Price Distribution):**
The distribution is unimodal and skewed to the right. The peak frequency occurs around a price of approximately $0.40 - $0.60, with a frequency of around 26. The frequency decreases as the price increases.
* Price $0.0 - $0.2: Frequency ~ 10
* Price $0.2 - $0.4: Frequency ~ 18
* Price $0.4 - $0.6: Frequency ~ 26
* Price $0.6 - $0.8: Frequency ~ 14
* Price $0.8 - $1.0: Frequency ~ 8
* Price $1.0 - $1.2: Frequency ~ 4
* Price $1.2 - $1.4: Frequency ~ 2
* Price $1.4 - $1.6: Frequency ~ 1
* Price $1.6 - $1.8: Frequency ~ 1
* Price $1.8 - $2.0: Frequency ~ 0
* Price $2.0 - $2.2: Frequency ~ 0
* Price $2.2 - $2.4: Frequency ~ 0
* Price $2.4 - $2.6: Frequency ~ 0
* Price $2.6 - $2.8: Frequency ~ 1
* Price $2.8 - $3.0: Frequency ~ 1
**Right Histogram (Duration Distribution):**
The distribution is approximately unimodal, with a peak frequency around a duration of approximately 180-200 seconds, with a frequency of around 17. The frequency decreases on both sides of the peak.
* Duration 0-100s: Frequency ~ 14
* Duration 100-200s: Frequency ~ 17
* Duration 200-300s: Frequency ~ 8
* Duration 300-400s: Frequency ~ 6
### Key Observations
* The price distribution is heavily concentrated in the lower price range (below $1.00).
* The duration distribution is centered around 180-200 seconds, with a significant number of responses falling within this range.
* There are very few responses with prices above $2.00.
* There are a small number of responses with durations exceeding 300 seconds.
### Interpretation
The data suggests that the majority of Claude 3.5 Sonnet responses are relatively inexpensive (under $1.00) and take around 3-4 minutes (180-200 seconds) to generate. The right skew in the price distribution indicates that while most responses are cheap, there are a few that are significantly more expensive. The duration distribution is more symmetrical, suggesting a more consistent response time. The relatively low frequency of high-priced responses and long durations could indicate that these are either rare cases or outliers. The data could be used to understand the cost and performance characteristics of the Claude 3.5 Sonnet model.