## Histograms: Price and Duration Distributions of Claude 3.5 Sonnet
### Overview
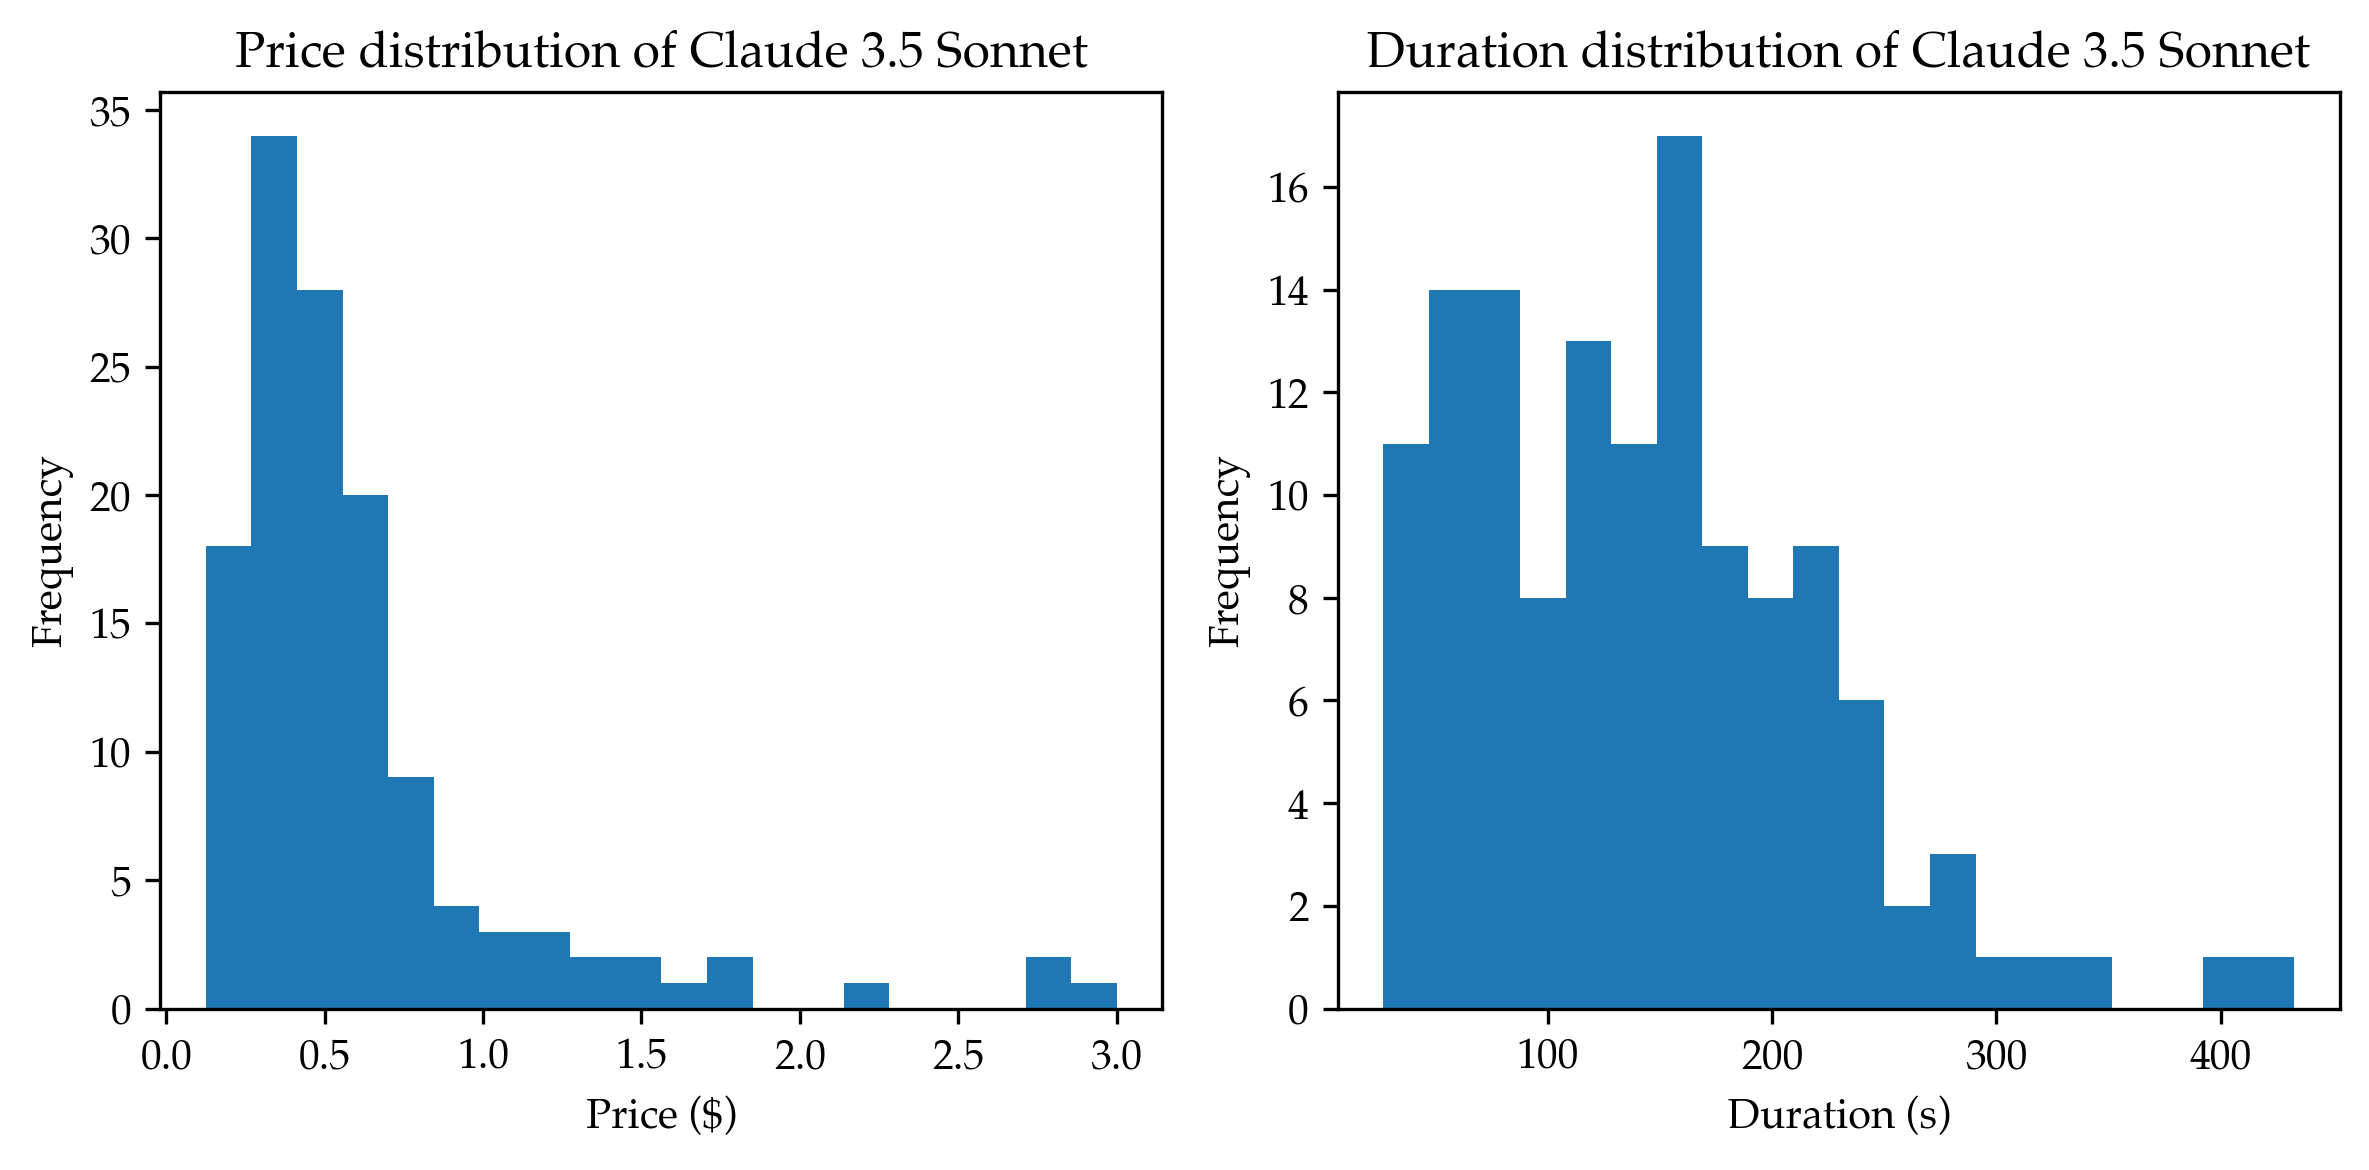
The image displays two side-by-side histograms presenting statistical distributions for a service or model named "Claude 3.5 Sonnet." The left histogram shows the distribution of cost (Price in USD), and the right histogram shows the distribution of processing time (Duration in seconds). Both charts share a similar visual style with blue bars on a white background, using a standard frequency count on the vertical axis.
### Components/Axes
**Left Histogram:**
* **Title:** "Price distribution of Claude 3.5 Sonnet"
* **X-axis Label:** "Price ($)"
* **X-axis Scale:** Linear scale from 0.0 to 3.0, with major tick marks at 0.0, 0.5, 1.0, 1.5, 2.0, 2.5, and 3.0.
* **Y-axis Label:** "Frequency"
* **Y-axis Scale:** Linear scale from 0 to 35, with major tick marks at intervals of 5 (0, 5, 10, 15, 20, 25, 30, 35).
**Right Histogram:**
* **Title:** "Duration distribution of Claude 3.5 Sonnet"
* **X-axis Label:** "Duration (s)"
* **X-axis Scale:** Linear scale from 0 to 400, with major tick marks at 100, 200, 300, and 400.
* **Y-axis Label:** "Frequency"
* **Y-axis Scale:** Linear scale from 0 to 16, with major tick marks at intervals of 2 (0, 2, 4, 6, 8, 10, 12, 14, 16).
**Spatial Layout:** The two histograms are positioned horizontally adjacent. The price distribution chart occupies the left half of the image, and the duration distribution chart occupies the right half. There is no shared legend, as each chart is a single data series.
### Detailed Analysis
**Price Distribution (Left Chart):**
* **Trend:** The distribution is strongly right-skewed (positively skewed). The frequency peaks sharply at the lower end of the price range and then decays rapidly, with a long tail extending towards higher prices.
* **Data Points (Approximate Bin Frequencies):**
* $0.0 - $0.25: ~18
* $0.25 - $0.50: ~34 (This is the modal bin, the highest peak)
* $0.50 - $0.75: ~28
* $0.75 - $1.00: ~20
* $1.00 - $1.25: ~9
* $1.25 - $1.50: ~4
* $1.50 - $1.75: ~3
* $1.75 - $2.00: ~3
* $2.00 - $2.25: ~2
* $2.25 - $2.50: ~1
* $2.50 - $2.75: ~0 (No visible bar)
* $2.75 - $3.00: ~2
* $3.00+: ~1 (A small bar appears just past the 3.0 mark)
**Duration Distribution (Right Chart):**
* **Trend:** The distribution is multimodal and right-skewed. It shows several local peaks, suggesting different common usage patterns or task complexities. The overall mass is concentrated between 0 and 250 seconds, with a tail extending to 400 seconds.
* **Data Points (Approximate Bin Frequencies):**
* 0 - 50s: ~11
* 50 - 100s: ~14
* 100 - 150s: ~8
* 150 - 200s: ~13
* 200 - 250s: ~11 (This appears to be the highest peak, the mode)
* 250 - 300s: ~9
* 300 - 350s: ~8
* 350 - 400s: ~6
* 400 - 450s: ~2
* 450 - 500s: ~3
* 500 - 550s: ~1
* 550 - 600s: ~1
* 600s+: ~1 (A small bar appears at the far right)
### Key Observations
1. **Price Concentration:** The vast majority of interactions (over 80% based on visual estimation of the area) cost less than $1.00. The most common price point is between $0.25 and $0.50.
2. **Price Outliers:** There is a very small number of interactions costing between $2.75 and $3.00+, indicating rare, high-cost events.
3. **Duration Variability:** Duration shows much higher variability than price. While there is a concentration below 250 seconds, significant activity occurs across the entire range up to 400 seconds.
4. **Multimodal Duration:** The presence of multiple peaks (around 50-100s, 150-200s, and 200-250s) suggests distinct categories of tasks—perhaps short queries, medium-complexity tasks, and longer, more involved processes.
5. **Right Skew in Both:** Both metrics are right-skewed, meaning the mean is likely greater than the median for each. This is typical for cost and time data, where a majority of cases are low-value, but a few high-value cases pull the average up.
### Interpretation
The data suggests that "Claude 3.5 Sonnet" is predominantly used for tasks that are low in cost and moderate in duration. The price distribution indicates a highly efficient or low-cost service for most applications, with the pricing model likely scaling with input/output tokens or computational complexity, resulting in the observed skew.
The duration distribution is more revealing of usage patterns. The multimodality implies the model is being applied to a heterogeneous set of problems. The peaks could correspond to:
* **Short tasks (~50-100s):** Simple Q&A, translation, or summarization.
* **Medium tasks (~150-250s):** Code generation, detailed analysis, or multi-step reasoning.
* **Long tasks (300s+):** Complex problem-solving, extensive document processing, or iterative creative work.
The correlation between the two charts is implied but not shown: longer durations likely correlate with higher prices. The presence of outliers in both charts (very high price, very long duration) points to edge cases—either exceptionally complex user requests or potential system inefficiencies. For a business or user, this data highlights that while the typical interaction is quick and cheap, planning for occasional longer and more expensive tasks is necessary. The distributions provide a baseline for expected performance and cost, useful for budgeting and capacity planning.