## Histograms: Price and Duration Distribution of Claude 3.5 Sonnet
### Overview
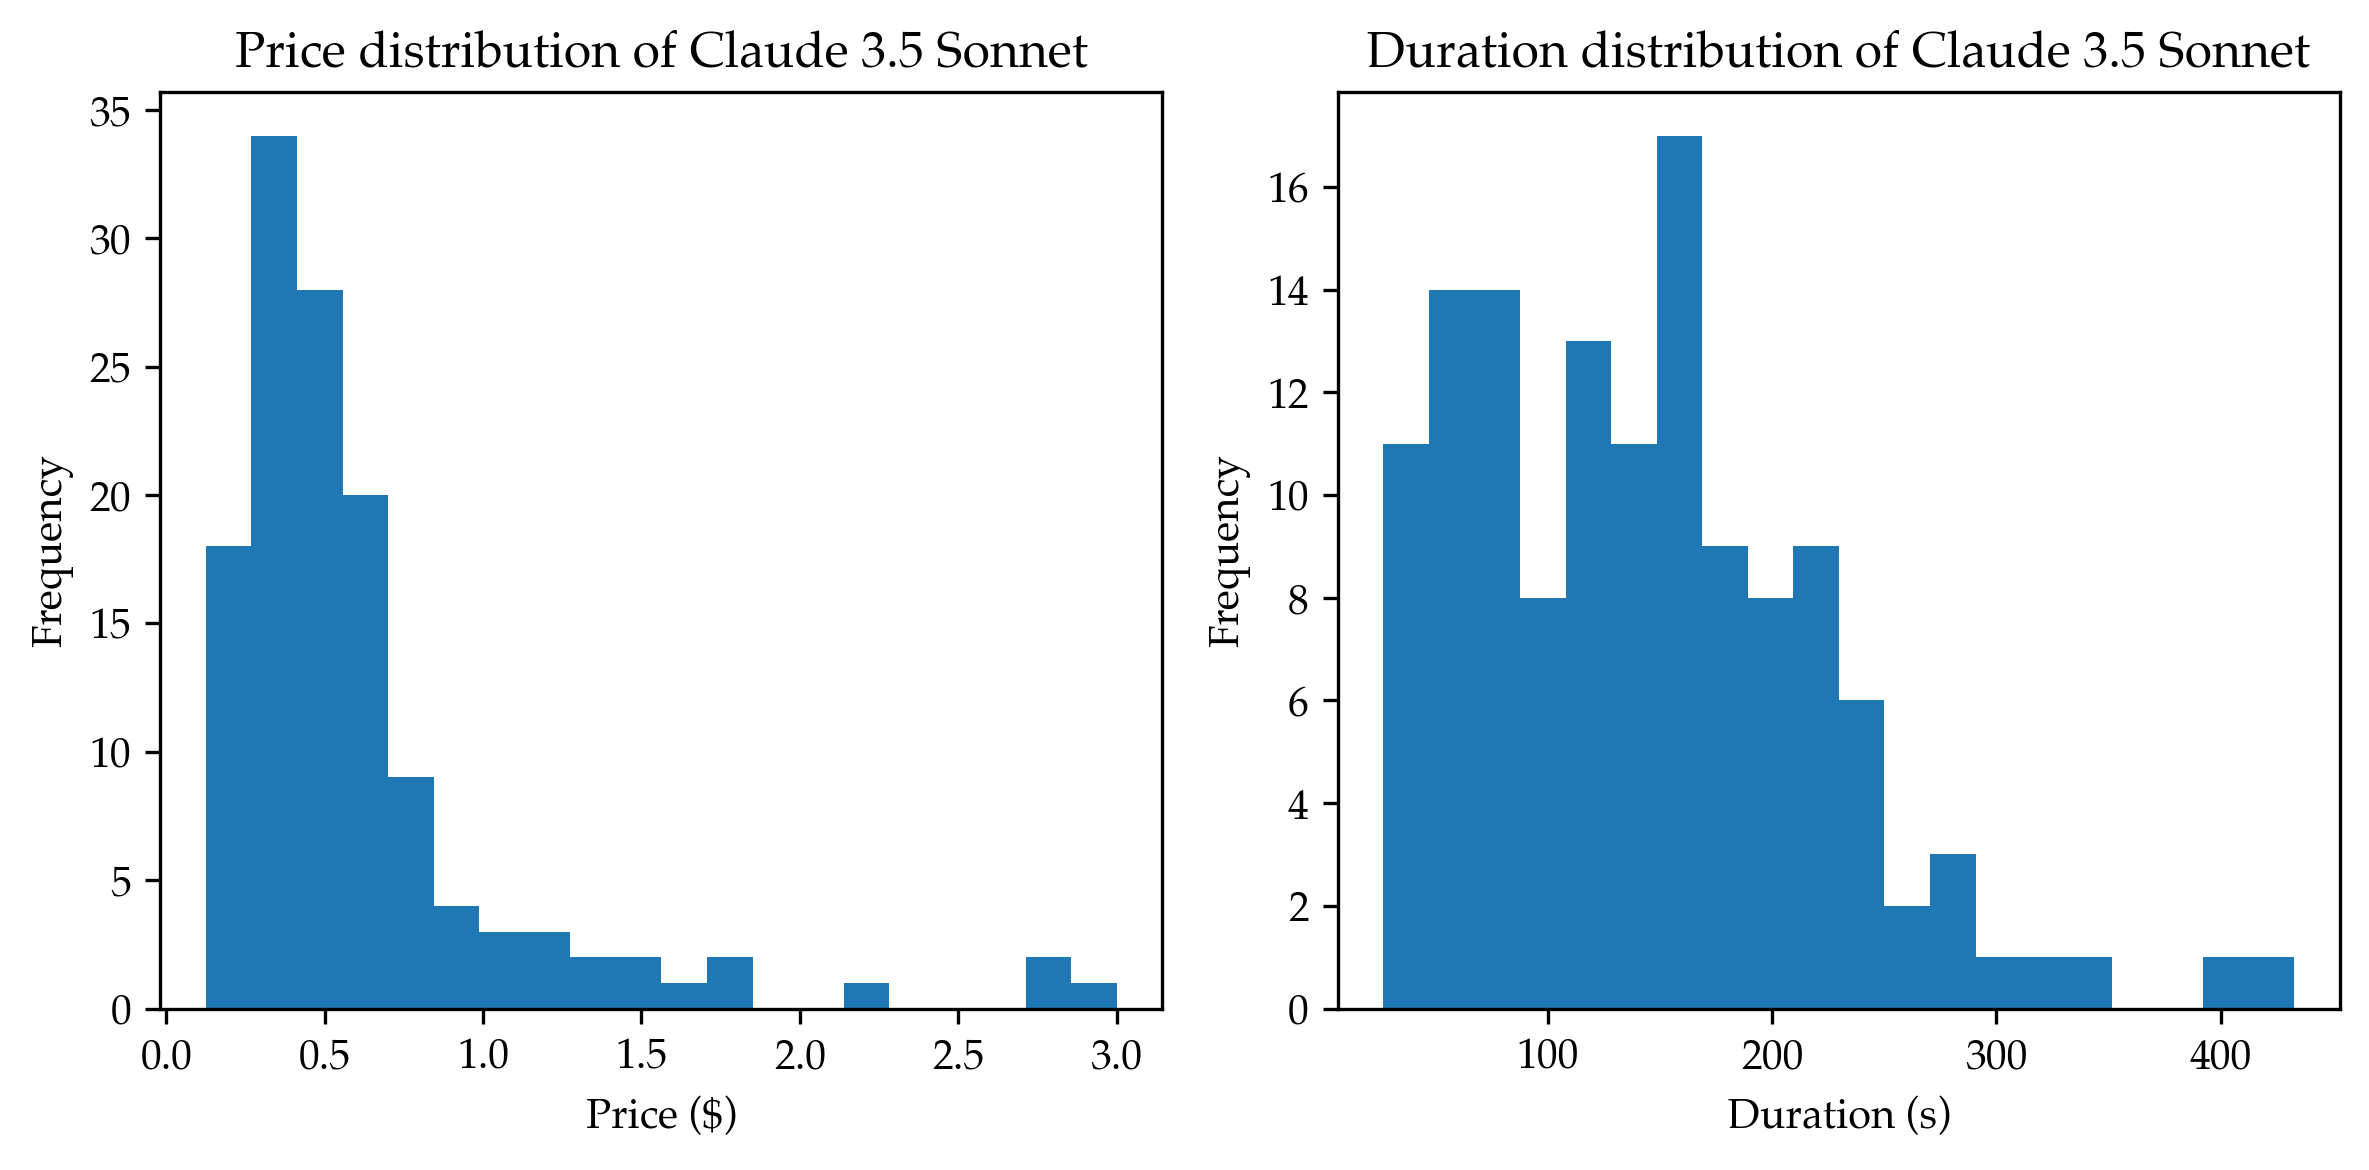
The image contains two side-by-side histograms analyzing the distribution of price and duration for Claude 3.5 Sonnet. The left histogram shows price distribution in dollars ($), while the right histogram displays duration distribution in seconds (s). Both histograms use blue bars to represent frequency counts.
### Components/Axes
- **Left Histogram (Price Distribution):**
- **X-axis (Price $):** Ranges from $0.0 to $3.0 in 0.5 increments.
- **Y-axis (Frequency):** Ranges from 0 to 35 in increments of 5.
- **Bars:** Blue, with heights corresponding to frequency counts.
- **Right Histogram (Duration Distribution):**
- **X-axis (Duration s):** Ranges from 0 to 400 seconds in 100-second increments.
- **Y-axis (Frequency):** Ranges from 0 to 18 in increments of 2.
- **Bars:** Blue, with heights corresponding to frequency counts.
### Detailed Analysis
#### Price Distribution
- **Key Trends:**
- The highest frequency (35) occurs at $0.25.
- Frequency decreases sharply for prices above $0.5, with a secondary peak at $0.75 (20 frequency).
- Frequencies drop to single digits for prices above $1.0, with sparse occurrences at $2.25 and $3.0.
- **Approximate Data Points (with uncertainty):**
- $0.0–$0.25: 35 frequency (highest).
- $0.25–$0.5: 28 frequency.
- $0.5–$0.75: 20 frequency.
- $0.75–$1.0: 9 frequency.
- $1.0–$1.5: 3 frequency.
- $1.5–$2.0: 2 frequency.
- $2.0–$2.5: 1 frequency.
- $2.5–$3.0: 2 frequency.
#### Duration Distribution
- **Key Trends:**
- The highest frequency (17) occurs at 150 seconds.
- A secondary peak at 100 seconds (14 frequency).
- Frequencies decline for durations above 200 seconds, with sparse occurrences at 300–400 seconds.
- **Approximate Data Points (with uncertainty):**
- 0–100s: 14 frequency.
- 100–150s: 17 frequency (peak).
- 150–200s: 12 frequency.
- 200–250s: 8 frequency.
- 250–300s: 3 frequency.
- 300–350s: 1 frequency.
- 350–400s: 1 frequency.
### Key Observations
1. **Price Distribution:**
- Most instances of Claude 3.5 Sonnet are priced below $1.0, with a concentration at $0.25–$0.75.
- Prices above $1.5 are rare, suggesting a tiered pricing model or limited high-cost usage.
2. **Duration Distribution:**
- The majority of durations cluster between 100–200 seconds, indicating typical usage patterns.
- Longer durations (300–400s) are infrequent, possibly representing edge cases or specialized tasks.
### Interpretation
The data suggests that Claude 3.5 Sonnet is primarily used for short, cost-effective interactions, with most users opting for lower-priced tiers and moderate durations. The sharp decline in frequency for higher prices and longer durations implies a design optimized for efficiency and accessibility. Outliers in price (e.g., $3.0) and duration (e.g., 400s) may reflect niche use cases, such as extended processing tasks or premium features. The histograms highlight a balance between affordability and performance, aligning with the model’s positioning as a versatile yet economical AI solution.