## Line Chart: Reward/Margin and Factuality Score vs. Lambda (Factuality Margin Penalty)
### Overview
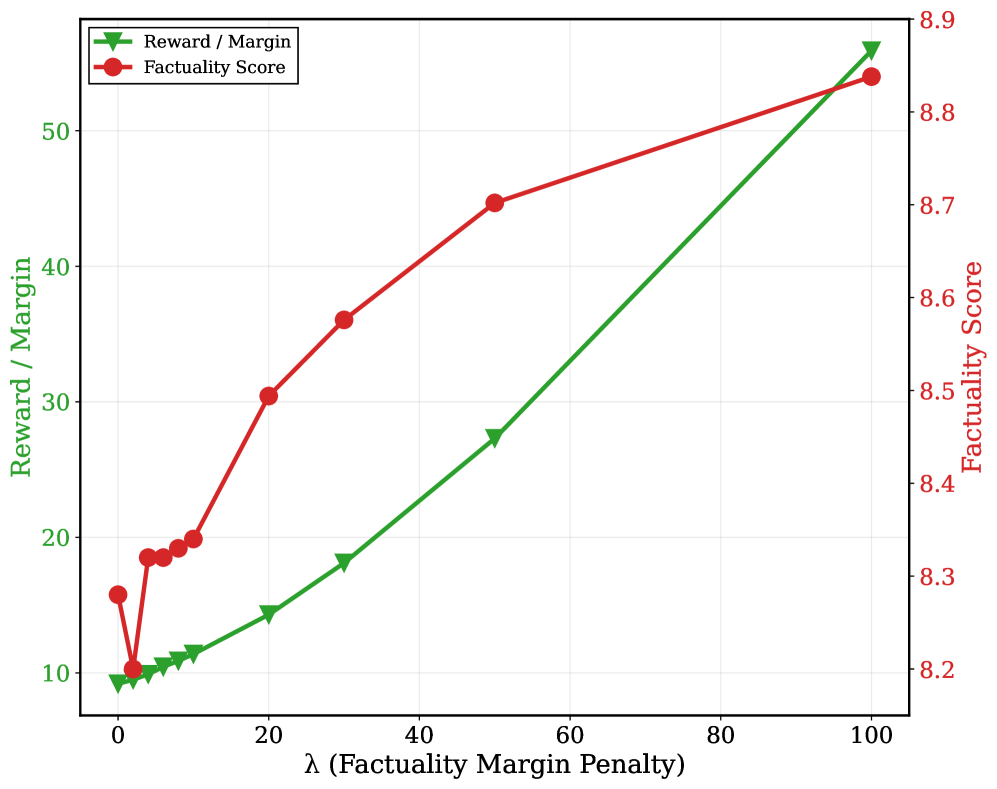
The image is a line chart that plots two data series: "Reward / Margin" and "Factuality Score" against "λ (Factuality Margin Penalty)". The chart uses two y-axes, one for each data series. The x-axis represents the "Factuality Margin Penalty" denoted by lambda (λ).
### Components/Axes
* **X-axis:** λ (Factuality Margin Penalty). Scale ranges from 0 to 100, with tick marks at 0, 20, 40, 60, 80, and 100.
* **Left Y-axis:** Reward / Margin. Scale ranges from 10 to 50, with tick marks at 10, 20, 30, 40, and 50.
* **Right Y-axis:** Factuality Score. Scale ranges from 8.2 to 8.9, with tick marks at 8.2, 8.3, 8.4, 8.5, 8.6, 8.7, 8.8, and 8.9.
* **Legend:** Located in the top-left corner.
* Green line with triangle markers: Reward / Margin
* Red line with circle markers: Factuality Score
### Detailed Analysis
* **Reward / Margin (Green):**
* Trend: Generally slopes upward.
* Data Points:
* λ = 0: Reward/Margin ≈ 9
* λ = 2: Reward/Margin ≈ 9.5
* λ = 5: Reward/Margin ≈ 10
* λ = 10: Reward/Margin ≈ 11
* λ = 20: Reward/Margin ≈ 14
* λ = 50: Reward/Margin ≈ 28
* λ = 100: Reward/Margin ≈ 54
* **Factuality Score (Red):**
* Trend: Increases rapidly initially, then increases at a slower rate.
* Data Points:
* λ = 0: Factuality Score ≈ 8.3
* λ = 2: Factuality Score ≈ 8.32
* λ = 5: Factuality Score ≈ 8.33
* λ = 10: Factuality Score ≈ 8.35
* λ = 20: Factuality Score ≈ 8.5
* λ = 30: Factuality Score ≈ 8.6
* λ = 50: Factuality Score ≈ 8.73
* λ = 100: Factuality Score ≈ 8.88
### Key Observations
* The "Reward / Margin" increases almost linearly with the "Factuality Margin Penalty" (λ).
* The "Factuality Score" increases rapidly for small values of λ, but the rate of increase slows down as λ increases.
* At λ = 0, the "Factuality Score" is approximately 8.3, and the "Reward / Margin" is approximately 9.
* At λ = 100, the "Factuality Score" is approximately 8.88, and the "Reward / Margin" is approximately 54.
### Interpretation
The chart suggests that increasing the "Factuality Margin Penalty" (λ) leads to an increase in both "Reward / Margin" and "Factuality Score". However, the "Factuality Score" experiences diminishing returns as λ increases, while the "Reward / Margin" continues to increase at a more consistent rate. This indicates that there might be an optimal value of λ where the "Factuality Score" is sufficiently high without sacrificing too much "Reward / Margin". The relationship between these two metrics is not linear, and the model benefits more from the penalty at lower values of lambda.