# Technical Data Extraction: Factuality Margin Penalty Analysis
## 1. Component Isolation
* **Header/Legend:** Located at the top-left [x: 0.08, y: 0.03] relative to the chart area. Contains two series identifiers.
* **Main Chart Area:** A dual-axis line graph with a shared X-axis. Features a light gray grid.
* **X-Axis (Bottom):** Represents the independent variable $\lambda$.
* **Primary Y-Axis (Left):** Represents "Reward / Margin" (Green).
* **Secondary Y-Axis (Right):** Represents "Factuality Score" (Red).
---
## 2. Axis and Label Extraction
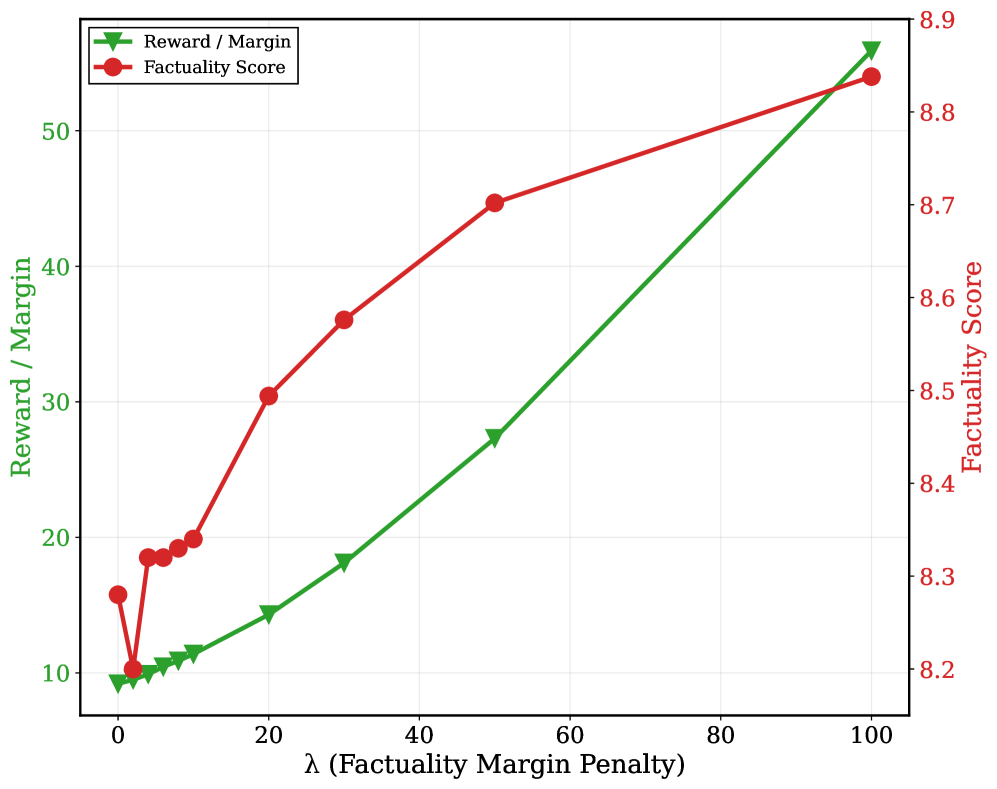
* **X-Axis Title:** $\lambda$ (Factuality Margin Penalty)
* **X-Axis Markers:** 0, 20, 40, 60, 80, 100
* **Primary Y-Axis Title (Left):** Reward / Margin (Color: Green)
* **Primary Y-Axis Markers:** 10, 20, 30, 40, 50
* **Secondary Y-Axis Title (Right):** Factuality Score (Color: Red/Brown)
* **Secondary Y-Axis Markers:** 8.2, 8.3, 8.4, 8.5, 8.6, 8.7, 8.8, 8.9
---
## 3. Legend and Series Identification
* **Series 1:**
* **Label:** Reward / Margin
* **Marker:** Green downward-pointing triangle ($\blacktriangledown$)
* **Line Color:** Green
* **Series 2:**
* **Label:** Factuality Score
* **Marker:** Red circle ($\bullet$)
* **Line Color:** Red/Brown
---
## 4. Trend Verification and Data Extraction
### Series 1: Reward / Margin (Green Line)
* **Visual Trend:** The line shows a consistent, monotonic upward slope. The rate of increase appears nearly linear, with a slight acceleration as $\lambda$ increases beyond 20.
* **Data Points (Estimated):**
* $\lambda = 0$: ~9.5
* $\lambda = 2$: ~10
* $\lambda = 4$: ~10.2
* $\lambda = 6$: ~10.5
* $\lambda = 8$: ~11
* $\lambda = 10$: ~11.5
* $\lambda = 20$: ~14.5
* $\lambda = 30$: ~18.5
* $\lambda = 50$: ~27.5
* $\lambda = 100$: ~56.0
### Series 2: Factuality Score (Red Line)
* **Visual Trend:** The trend is generally upward but non-monotonic at the start. There is a sharp dip between $\lambda=0$ and $\lambda=2$, followed by a steep recovery and a decelerating (concave) growth curve as $\lambda$ approaches 100.
* **Data Points (Estimated):**
* $\lambda = 0$: ~8.28
* $\lambda = 2$: ~8.20 (Local Minimum)
* $\lambda = 4$: ~8.32
* $\lambda = 6$: ~8.32
* $\lambda = 8$: ~8.33
* $\lambda = 10$: ~8.34
* $\lambda = 20$: ~8.50
* $\lambda = 30$: ~8.58
* $\lambda = 50$: ~8.71
* $\lambda = 100$: ~8.84
---
## 5. Data Table Reconstruction
| $\lambda$ (Penalty) | Reward / Margin (Green) | Factuality Score (Red) |
| :--- | :--- | :--- |
| 0 | ~9.5 | ~8.28 |
| 2 | ~10.0 | ~8.20 |
| 4 | ~10.2 | ~8.32 |
| 6 | ~10.5 | ~8.32 |
| 8 | ~11.0 | ~8.33 |
| 10 | ~11.5 | ~8.34 |
| 20 | ~14.5 | ~8.50 |
| 30 | ~18.5 | ~8.58 |
| 50 | ~27.5 | ~8.71 |
| 100 | ~56.0 | ~8.84 |
---
## 6. Technical Summary
The chart illustrates the relationship between the **Factuality Margin Penalty ($\lambda$)** and two performance metrics.
1. **Reward / Margin** scales positively and significantly with the penalty, increasing by a factor of approximately 6x over the observed range.
2. **Factuality Score** exhibits an initial instability (a dip at low penalty levels) but eventually stabilizes into a positive correlation, though the gains diminish as the penalty exceeds 50.
3. The intersection of the visual trends suggests that increasing the penalty is effective for driving both metrics upward after the initial threshold of $\lambda > 2$.