\n
## Line Chart: Reward/Margin vs. Factuality Score
### Overview
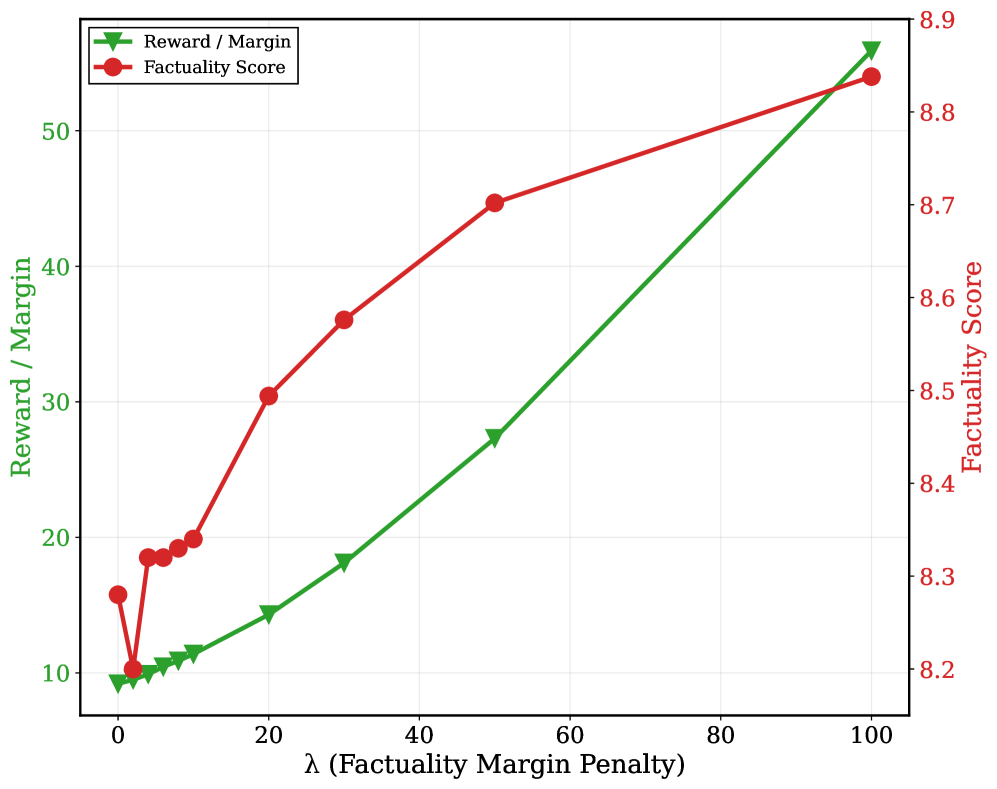
This image presents a line chart comparing "Reward / Margin" and "Factuality Score" as a function of "λ (Factuality Margin Penalty)". The chart displays two distinct lines, one representing Reward/Margin and the other representing Factuality Score, both plotted against the same x-axis. A secondary y-axis on the right side of the chart displays the scale for the Factuality Score.
### Components/Axes
* **X-axis:** λ (Factuality Margin Penalty), ranging from 0 to 100. The axis is labeled at intervals of 20.
* **Primary Y-axis (left):** Reward / Margin, ranging from 10 to 50. The axis is labeled at intervals of 10.
* **Secondary Y-axis (right):** Factuality Score, ranging from 8.2 to 8.9. The axis is labeled at intervals of 0.1.
* **Legend (top-left):**
* Blue line: Reward / Margin
* Red line: Factuality Score
* **Gridlines:** Horizontal and vertical gridlines are present to aid in reading values.
### Detailed Analysis
**Reward / Margin (Blue Line):**
The blue line representing Reward/Margin starts at approximately 10.5 at λ = 0. It exhibits a generally upward trend, with a steeper slope from λ = 0 to λ = 40. The line continues to rise, reaching approximately 58 at λ = 100.
* λ = 0: Reward/Margin ≈ 10.5
* λ = 20: Reward/Margin ≈ 18
* λ = 40: Reward/Margin ≈ 36
* λ = 60: Reward/Margin ≈ 45
* λ = 80: Reward/Margin ≈ 52
* λ = 100: Reward/Margin ≈ 58
**Factuality Score (Red Line):**
The red line representing Factuality Score begins at approximately 8.25 at λ = 0. It initially dips slightly to around 8.2 at λ = 5, then rises steadily and consistently. The slope is relatively constant throughout the range.
* λ = 0: Factuality Score ≈ 8.25
* λ = 20: Factuality Score ≈ 8.45
* λ = 40: Factuality Score ≈ 8.65
* λ = 60: Factuality Score ≈ 8.75
* λ = 80: Factuality Score ≈ 8.85
* λ = 100: Factuality Score ≈ 8.9
### Key Observations
* Both Reward/Margin and Factuality Score increase as λ (Factuality Margin Penalty) increases.
* The Reward/Margin exhibits a more pronounced initial increase than the Factuality Score.
* The Factuality Score shows a consistent, linear increase across the entire range of λ.
* There is a clear trade-off between reward/margin and factuality, as increasing the penalty for factual inaccuracies (λ) leads to higher factuality scores but also impacts the reward/margin.
### Interpretation
The chart demonstrates the relationship between a reward/margin metric and a factuality score, modulated by a penalty factor (λ). The increasing trend of both metrics with increasing λ suggests that prioritizing factual accuracy (by increasing the penalty for inaccuracies) leads to both higher factuality and, surprisingly, higher rewards/margins. This could indicate that factual accuracy is a key driver of overall performance or that the reward system is designed to incentivize factual correctness. The initial dip in the Factuality Score at low λ values might represent a scenario where minimal penalty for inaccuracies leads to a slight decrease in overall factuality. The consistent linear increase in Factuality Score suggests a direct and predictable relationship between the penalty and the accuracy of the output. The steeper initial rise in Reward/Margin suggests that the initial increase in factuality has a disproportionately positive impact on the reward/margin. This data could be used to optimize the λ parameter to achieve a desired balance between reward/margin and factuality.