## Dual-Axis Line Chart: Reward/Margin and Factuality Score vs. λ (Factuality Margin Penalty)
### Overview
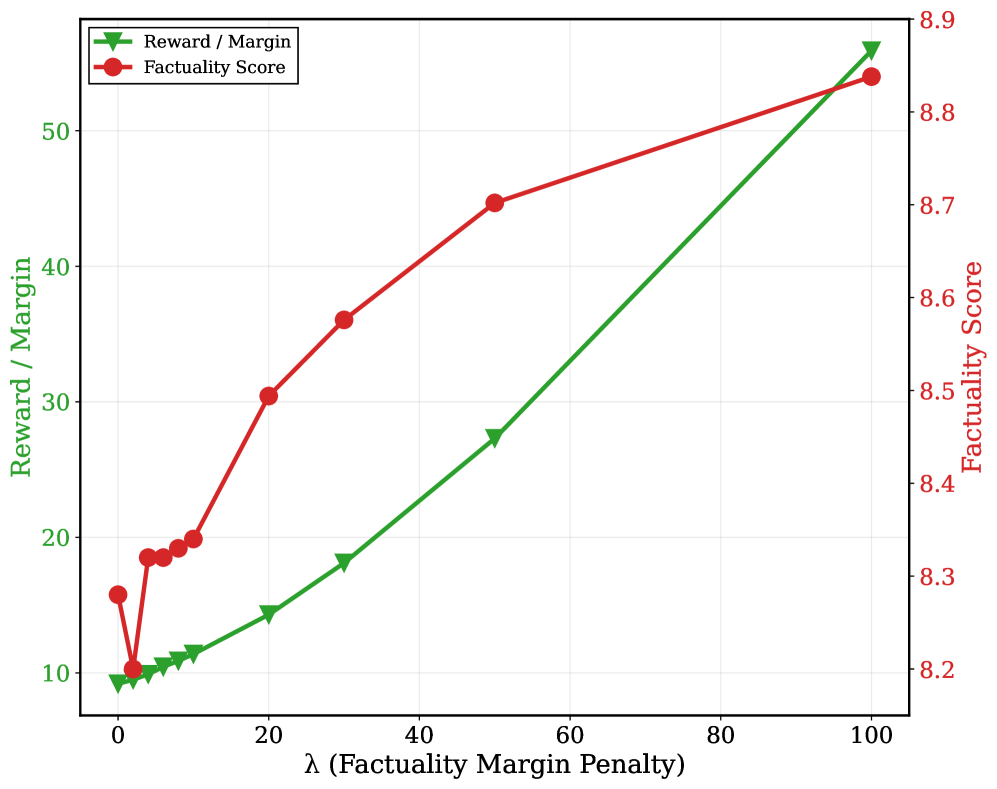
This image is a dual-axis line chart plotting two different metrics against a common independent variable, λ (Factuality Margin Penalty). The chart demonstrates how both a "Reward / Margin" metric and a "Factuality Score" change as the penalty parameter λ increases from 0 to 100. The two metrics are measured on separate y-axes with different scales.
### Components/Axes
* **Chart Type:** Dual-axis line chart.
* **X-Axis (Bottom):**
* **Label:** `λ (Factuality Margin Penalty)`
* **Scale:** Linear, ranging from 0 to 100.
* **Major Tick Marks:** 0, 20, 40, 60, 80, 100.
* **Primary Y-Axis (Left):**
* **Label:** `Reward / Margin` (text colored green).
* **Scale:** Linear, ranging from 10 to 50.
* **Major Tick Marks:** 10, 20, 30, 40, 50.
* **Secondary Y-Axis (Right):**
* **Label:** `Factuality Score` (text colored red).
* **Scale:** Linear, ranging from 8.2 to 8.9.
* **Major Tick Marks:** 8.2, 8.3, 8.4, 8.5, 8.6, 8.7, 8.8, 8.9.
* **Legend (Top-Left Corner, inside plot area):**
* **Entry 1:** `Reward / Margin` - Represented by a green line with downward-pointing triangle markers (▼).
* **Entry 2:** `Factuality Score` - Represented by a red line with circle markers (●).
### Detailed Analysis
**Data Series 1: Reward / Margin (Green Line, Left Y-Axis)**
* **Trend:** The line shows an overall upward, accelerating trend. It starts low, has a slight dip, then increases at a growing rate.
* **Approximate Data Points (λ, Reward/Margin):**
* (0, ~9.8)
* (2, ~9.5) *[Note: Slight dip]*
* (5, ~10.2)
* (8, ~10.8)
* (10, ~11.2)
* (20, ~14.5)
* (30, ~18.2)
* (50, ~27.5)
* (100, ~53.0)
**Data Series 2: Factuality Score (Red Line, Right Y-Axis)**
* **Trend:** The line shows an overall upward trend with a sharp initial increase that gradually tapers off (concave down). It also has a notable dip at the second data point.
* **Approximate Data Points (λ, Factuality Score):**
* (0, ~8.28)
* (2, ~8.20) *[Note: Significant dip]*
* (5, ~8.34)
* (8, ~8.35)
* (10, ~8.36)
* (20, ~8.50)
* (30, ~8.58)
* (50, ~8.70)
* (100, ~8.84)
### Key Observations
1. **Correlated Initial Dip:** Both metrics experience a decrease in value when λ moves from 0 to 2, suggesting an initial negative impact from introducing a small penalty.
2. **Divergent Growth Rates:** After λ=2, both metrics increase, but their growth patterns differ. The Reward/Margin (green) grows at an accelerating rate (convex curve), while the Factuality Score (red) grows at a decelerating rate (concave curve).
3. **Crossover in Visual Slope:** While both lines trend upward, the green line's slope becomes visually steeper than the red line's slope for λ > ~50, indicating the Reward/Margin is becoming more sensitive to increases in λ at higher values.
4. **Scale Sensitivity:** The Factuality Score operates on a very narrow scale (8.2 to 8.9), meaning small visual changes represent significant relative improvements. The Reward/Margin has a much broader scale (10 to 50).
### Interpretation
This chart likely visualizes the results of a machine learning or optimization experiment where `λ` is a hyperparameter controlling a penalty for factuality margin. The data suggests a trade-off and relationship between two objectives:
* **Core Finding:** Increasing the factuality margin penalty (`λ`) generally improves both the model's reward/margin and its factuality score, but with diminishing returns for the latter.
* **The Initial Dip (λ=0 to 2):** This is a critical anomaly. It implies that applying a very small penalty is worse than applying no penalty at all for both metrics. This could be due to the penalty disrupting an initial equilibrium without providing enough signal for meaningful improvement.
* **Diverging Objectives:** The accelerating growth of Reward/Margin suggests this metric benefits strongly from aggressive penalties. In contrast, the decelerating growth of the Factuality Score indicates it is harder to improve at higher levels, possibly hitting a ceiling or requiring exponentially more "pressure" (higher λ) for smaller gains.
* **Practical Implication:** The choice of `λ` involves a balance. A value around 20-50 might offer a good compromise, yielding substantial gains in both metrics before the Factuality Score's improvement rate slows significantly. Setting `λ` very high (e.g., 100) maximizes Reward/Margin but may not be the most efficient way to gain further improvements in Factuality Score. The chart provides the empirical basis for selecting this hyperparameter based on the relative importance of the two metrics.