## Line Graph: Relationship Between Factuality Margin Penalty (λ) and Reward/Margin vs. Factually Score
### Overview
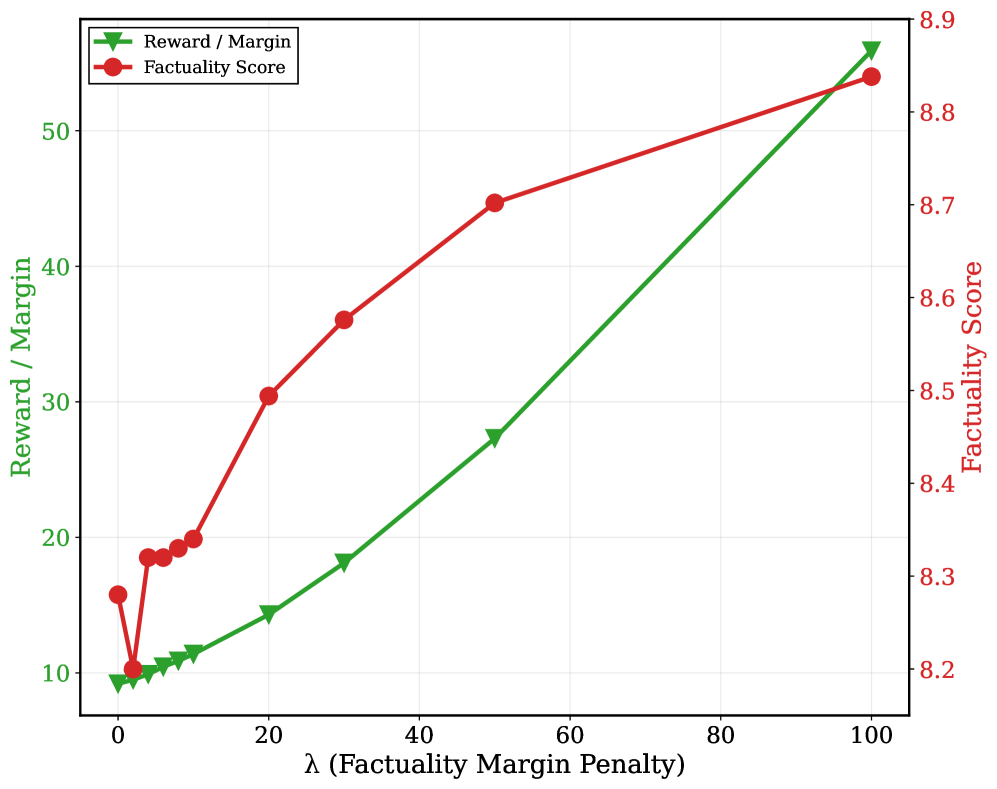
The image depicts a dual-axis line graph comparing two metrics: "Reward / Margin" (green line) and "Factually Score" (red line) as they vary with the "Factuality Margin Penalty" (λ). The graph spans λ values from 0 to 100, with distinct trends observed for both metrics.
### Components/Axes
- **X-axis**: Labeled "λ (Factuality Margin Penalty)", ranging from 0 to 100 in increments of 20.
- **Left Y-axis**: Labeled "Reward / Margin", scaled from 10 to 50 in increments of 10.
- **Right Y-axis**: Labeled "Factually Score", scaled from 8.2 to 8.9 in increments of 0.1.
- **Legend**: Located in the top-left corner, associating:
- Green line with "Reward / Margin" (triangle markers).
- Red line with "Factually Score" (circle markers).
### Detailed Analysis
#### Reward / Margin (Green Line)
- **Trend**: Steadily increases from λ=0 to λ=100.
- **Data Points**:
- λ=0: 10
- λ=20: 15
- λ=40: 25
- λ=60: 35
- λ=80: 45
- λ=100: 55
- **Slope**: Approximately linear, with a consistent upward trajectory.
#### Factually Score (Red Line)
- **Trend**: Gradual increase from λ=0 to λ=100, with a plateau near the end.
- **Data Points**:
- λ=0: 15
- λ=20: 30
- λ=40: 45
- λ=60: 50
- λ=80: 52
- λ=100: 53
- **Slope**: Initially steep, then flattens after λ=60.
### Key Observations
1. **Crossover Point**: The green line ("Reward / Margin") surpasses the red line ("Factually Score") at λ=100, ending at 55 vs. 53.
2. **Divergence**: The green line’s slope is steeper than the red line’s, indicating a stronger response to λ increases.
3. **Plateau**: The red line’s growth slows significantly after λ=60, suggesting diminishing returns for Factually Score.
### Interpretation
The data suggests that increasing the Factuality Margin Penalty (λ) improves both metrics, but "Reward / Margin" benefits more substantially. The Factually Score’s plateau implies that beyond λ=60, additional penalties yield minimal gains, potentially due to system constraints or optimization limits. The crossover at λ=100 highlights a trade-off: maximizing Reward/Margin may require tolerating slightly lower Factually Scores. This could inform tuning strategies for systems balancing factual accuracy and reward efficiency.