## Diagram: Challenge vs. Capability
### Overview
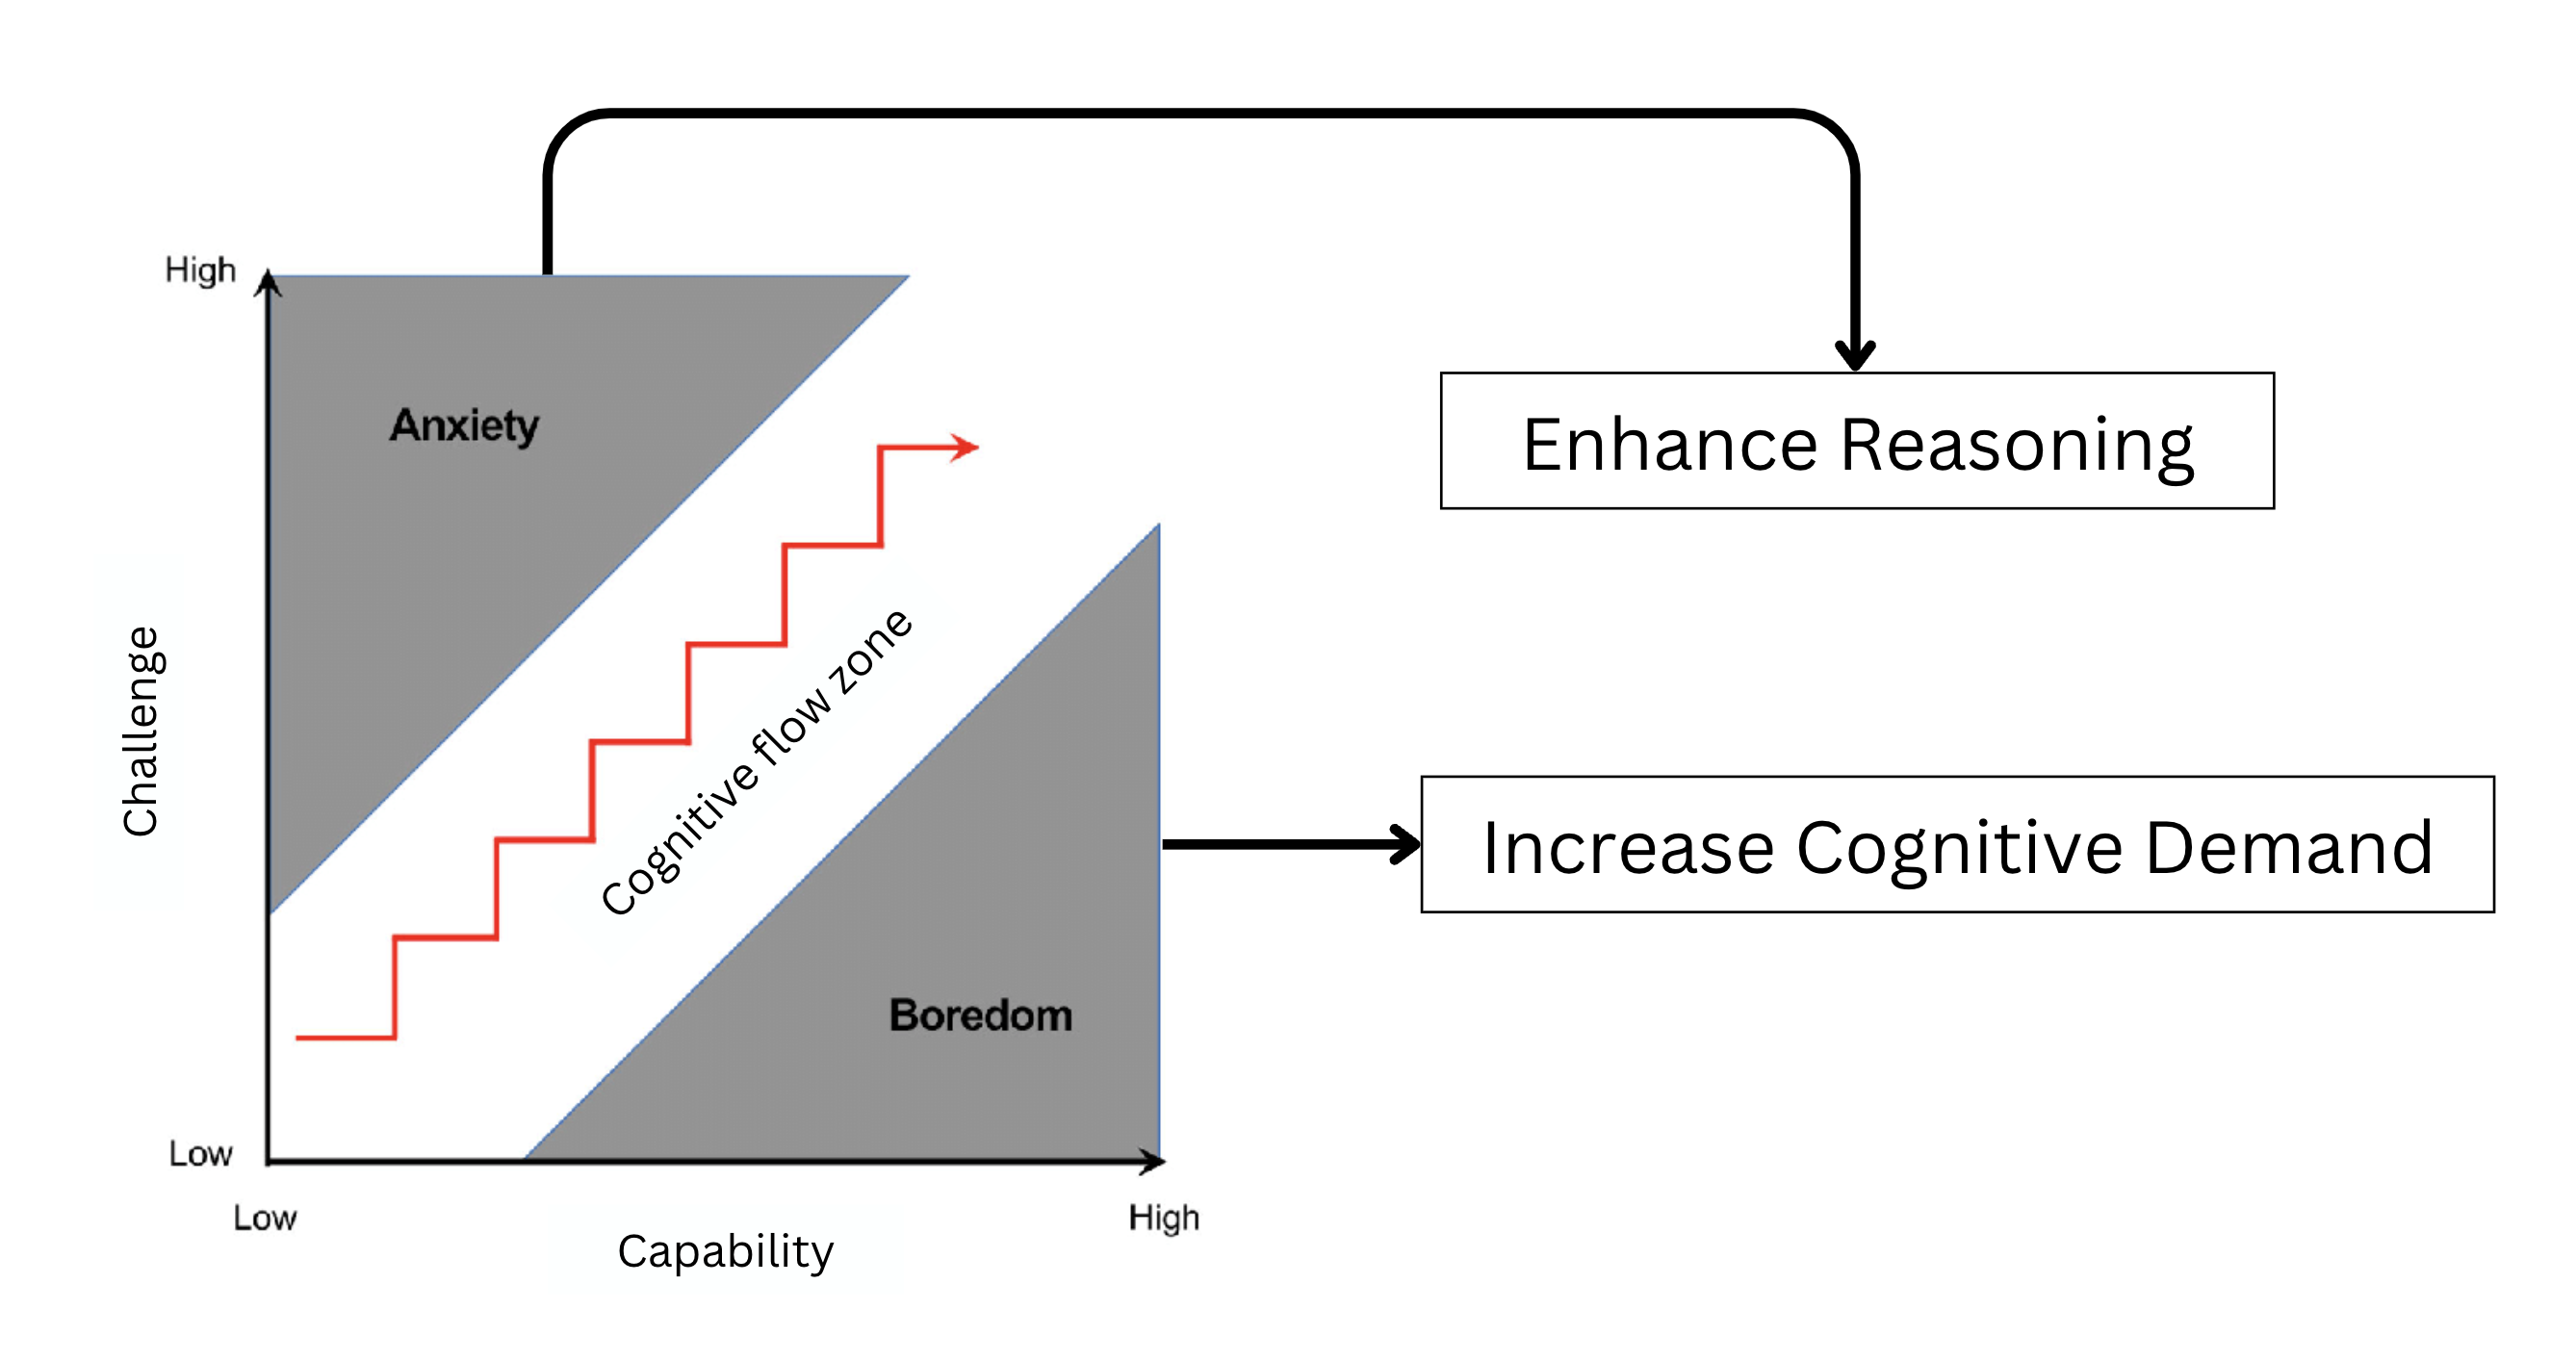
The image is a diagram illustrating the relationship between challenge and capability, and how they relate to states of anxiety, boredom, and a "cognitive flow zone." It also shows how these states can influence reasoning and cognitive demand.
### Components/Axes
* **X-axis:** Capability, labeled "Low" on the left and "High" on the right.
* **Y-axis:** Challenge, labeled "Low" at the bottom and "High" at the top.
* **Regions:**
* Top-left: Gray area labeled "Anxiety."
* Bottom-right: Gray area labeled "Boredom."
* Diagonal white area between the gray areas: Labeled "Cognitive flow zone."
* **Red Stepped Line:** Represents a path through the "Cognitive flow zone," moving from low capability/low challenge to high capability/high challenge.
* **Arrows:**
* A black arrow points from the top of the "Cognitive flow zone" to a box labeled "Enhance Reasoning."
* A black arrow points from the bottom of the "Cognitive flow zone" to a box labeled "Increase Cognitive Demand."
### Detailed Analysis
* **Axes:** The X and Y axes represent Capability and Challenge, respectively. Both axes range from "Low" to "High."
* **Anxiety Region:** The gray area in the top-left corner represents a state of anxiety, which occurs when the challenge is high but the capability is low.
* **Boredom Region:** The gray area in the bottom-right corner represents a state of boredom, which occurs when the capability is high but the challenge is low.
* **Cognitive Flow Zone:** The white diagonal area represents the "Cognitive flow zone," where the challenge and capability are balanced.
* **Red Stepped Line:** The red stepped line within the "Cognitive flow zone" indicates a path of increasing capability and challenge. It starts at the bottom-left and moves upwards and to the right in discrete steps.
* **Enhance Reasoning:** The arrow from the top of the "Cognitive flow zone" to "Enhance Reasoning" suggests that being in a state of flow can improve reasoning abilities.
* **Increase Cognitive Demand:** The arrow from the bottom of the "Cognitive flow zone" to "Increase Cognitive Demand" suggests that being in a state of flow can increase cognitive demand.
### Key Observations
* The diagram illustrates that a balance between challenge and capability is essential for achieving a state of "cognitive flow."
* High challenge with low capability leads to anxiety, while high capability with low challenge leads to boredom.
* The "Cognitive flow zone" is a diagonal band where challenge and capability are aligned.
* Moving through the "Cognitive flow zone" involves a gradual increase in both challenge and capability.
* Being in the "Cognitive flow zone" can enhance reasoning and increase cognitive demand.
### Interpretation
The diagram presents a model for understanding the relationship between challenge, capability, and cognitive states. It suggests that optimal performance and engagement occur when there is a balance between the demands of a task (challenge) and the individual's ability to meet those demands (capability). The "Cognitive flow zone" represents this optimal state, where individuals are neither overwhelmed by anxiety nor disengaged by boredom. The diagram also implies that being in this state can lead to improved reasoning and increased cognitive engagement. The stepped line suggests that growth within the flow zone involves incremental increases in both challenge and capability. The arrows to "Enhance Reasoning" and "Increase Cognitive Demand" suggest positive outcomes associated with maintaining this balance.