\n
## Diagram: Flow State Model
### Overview
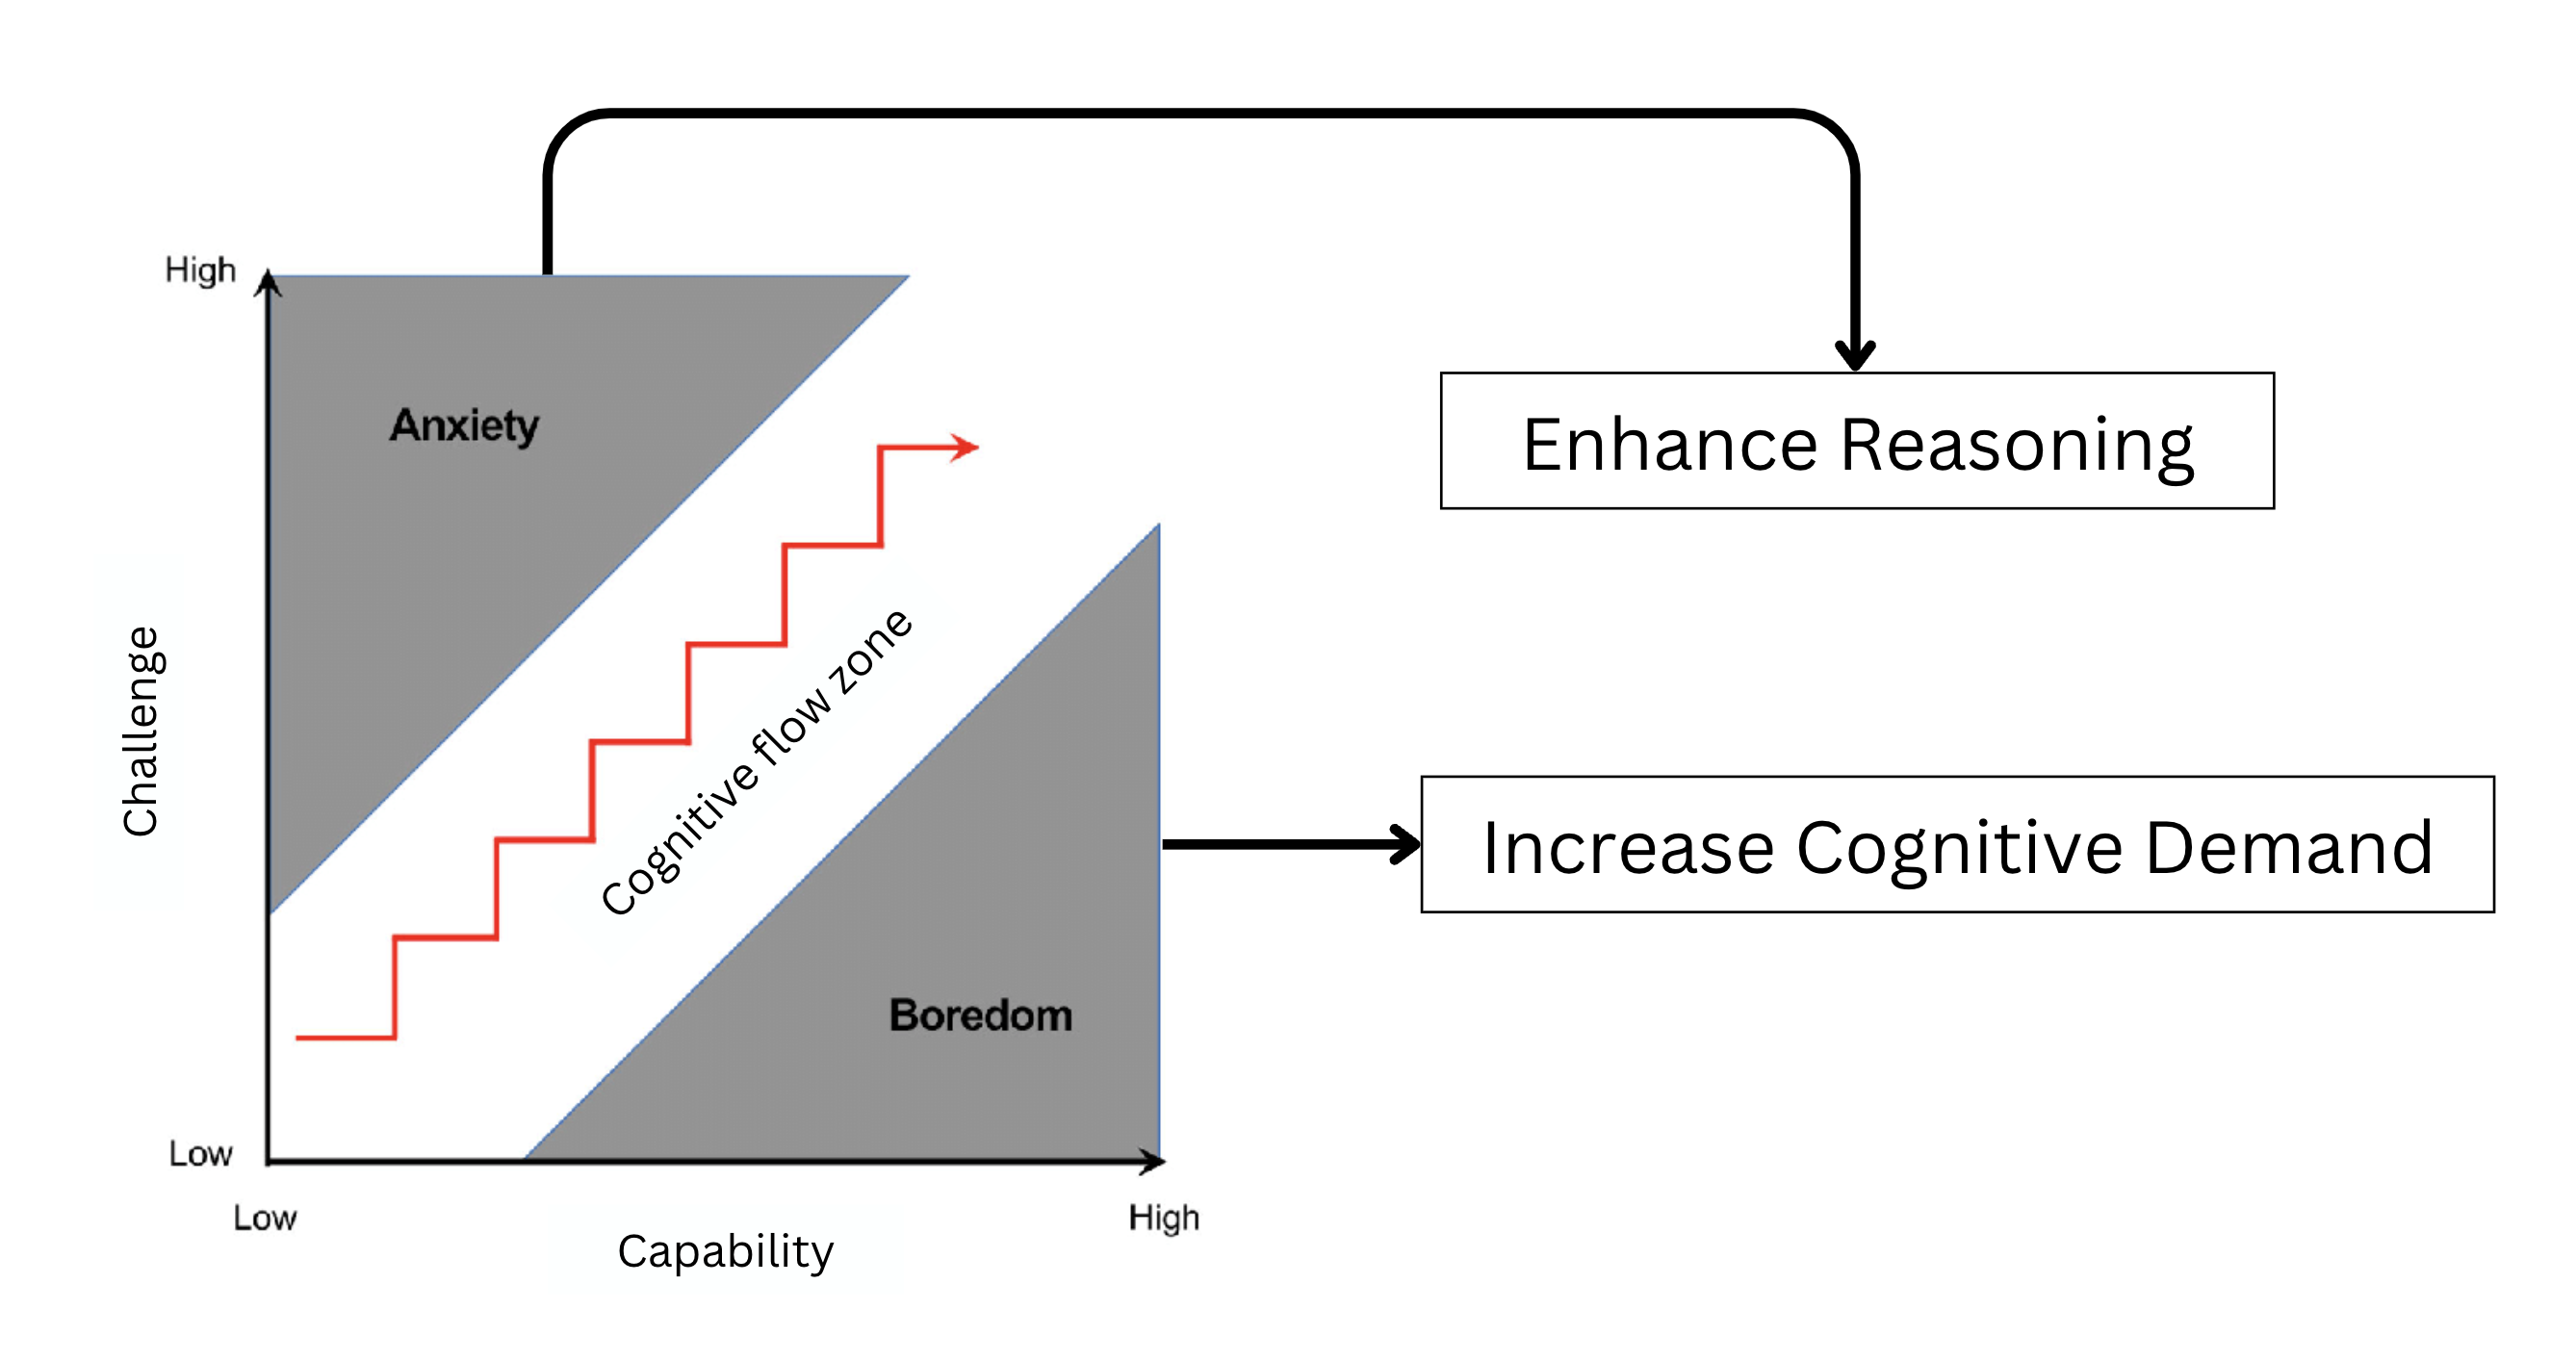
The image depicts a diagram illustrating the relationship between challenge, capability, and resulting emotional states (anxiety, boredom, and flow). It also shows how to move towards a state of enhanced reasoning. The diagram uses a 2D graph and a flow chart to convey this information.
### Components/Axes
* **X-axis:** Labeled "Capability", ranging from "Low" to "High".
* **Y-axis:** Labeled "Challenge", ranging from "Low" to "High".
* **Zones:** Three zones are defined by the axes:
* "Anxiety" (top-left quadrant)
* "Boredom" (bottom-right quadrant)
* "Cognitive flow zone" (diagonal band between Anxiety and Boredom)
* **Flow Arrow:** A red, stepped arrow indicates the path through the "Cognitive flow zone", starting from low capability/challenge and moving towards high capability/challenge.
* **Flow Chart:** Two rectangular boxes connected by a curved arrow:
* "Enhance Reasoning" (top box)
* "Increase Cognitive Demand" (bottom box)
### Detailed Analysis or Content Details
The diagram presents a model where optimal performance and engagement occur within the "Cognitive flow zone". This zone exists when challenge and capability are appropriately balanced.
* **Anxiety Zone:** High challenge, low capability.
* **Boredom Zone:** Low challenge, high capability.
* **Cognitive Flow Zone:** The stepped arrow indicates a progression through the cognitive flow zone. While precise values are not given, the arrow suggests a gradual increase in both challenge and capability. The arrow has approximately 8 steps.
* **Flow Chart:** The curved arrow points from "Increase Cognitive Demand" to "Enhance Reasoning", suggesting that increasing cognitive demand leads to enhanced reasoning abilities.
### Key Observations
* The diagram emphasizes the importance of balancing challenge and capability for optimal performance.
* The "Cognitive flow zone" is presented as the ideal state.
* The flow chart suggests a cyclical relationship between cognitive demand and reasoning ability.
* The diagram does not provide quantitative data, but rather a conceptual model.
### Interpretation
The diagram illustrates a psychological model of optimal experience, often referred to as "flow". This model suggests that individuals perform best when they are faced with challenges that are appropriately matched to their skills. If a challenge is too high relative to an individual's capabilities, it can lead to anxiety. Conversely, if a challenge is too low, it can lead to boredom. The "Cognitive flow zone" represents the sweet spot where individuals are fully engaged and motivated.
The flow chart component suggests a method for achieving enhanced reasoning: by increasing cognitive demand. This implies that pushing oneself to tackle more complex problems can lead to improved cognitive abilities. The cyclical nature of the arrow suggests that enhanced reasoning, in turn, allows one to handle even greater cognitive demands.
The diagram is a simplified representation of a complex phenomenon. It does not account for individual differences in tolerance for challenge or the potential for burnout. However, it provides a useful framework for understanding the relationship between challenge, capability, and performance. The stepped arrow in the "Cognitive flow zone" suggests that progress is not always linear, but rather involves incremental steps.