## Line Chart: BBH Date Understanding — Step-wise Accuracy
### Overview
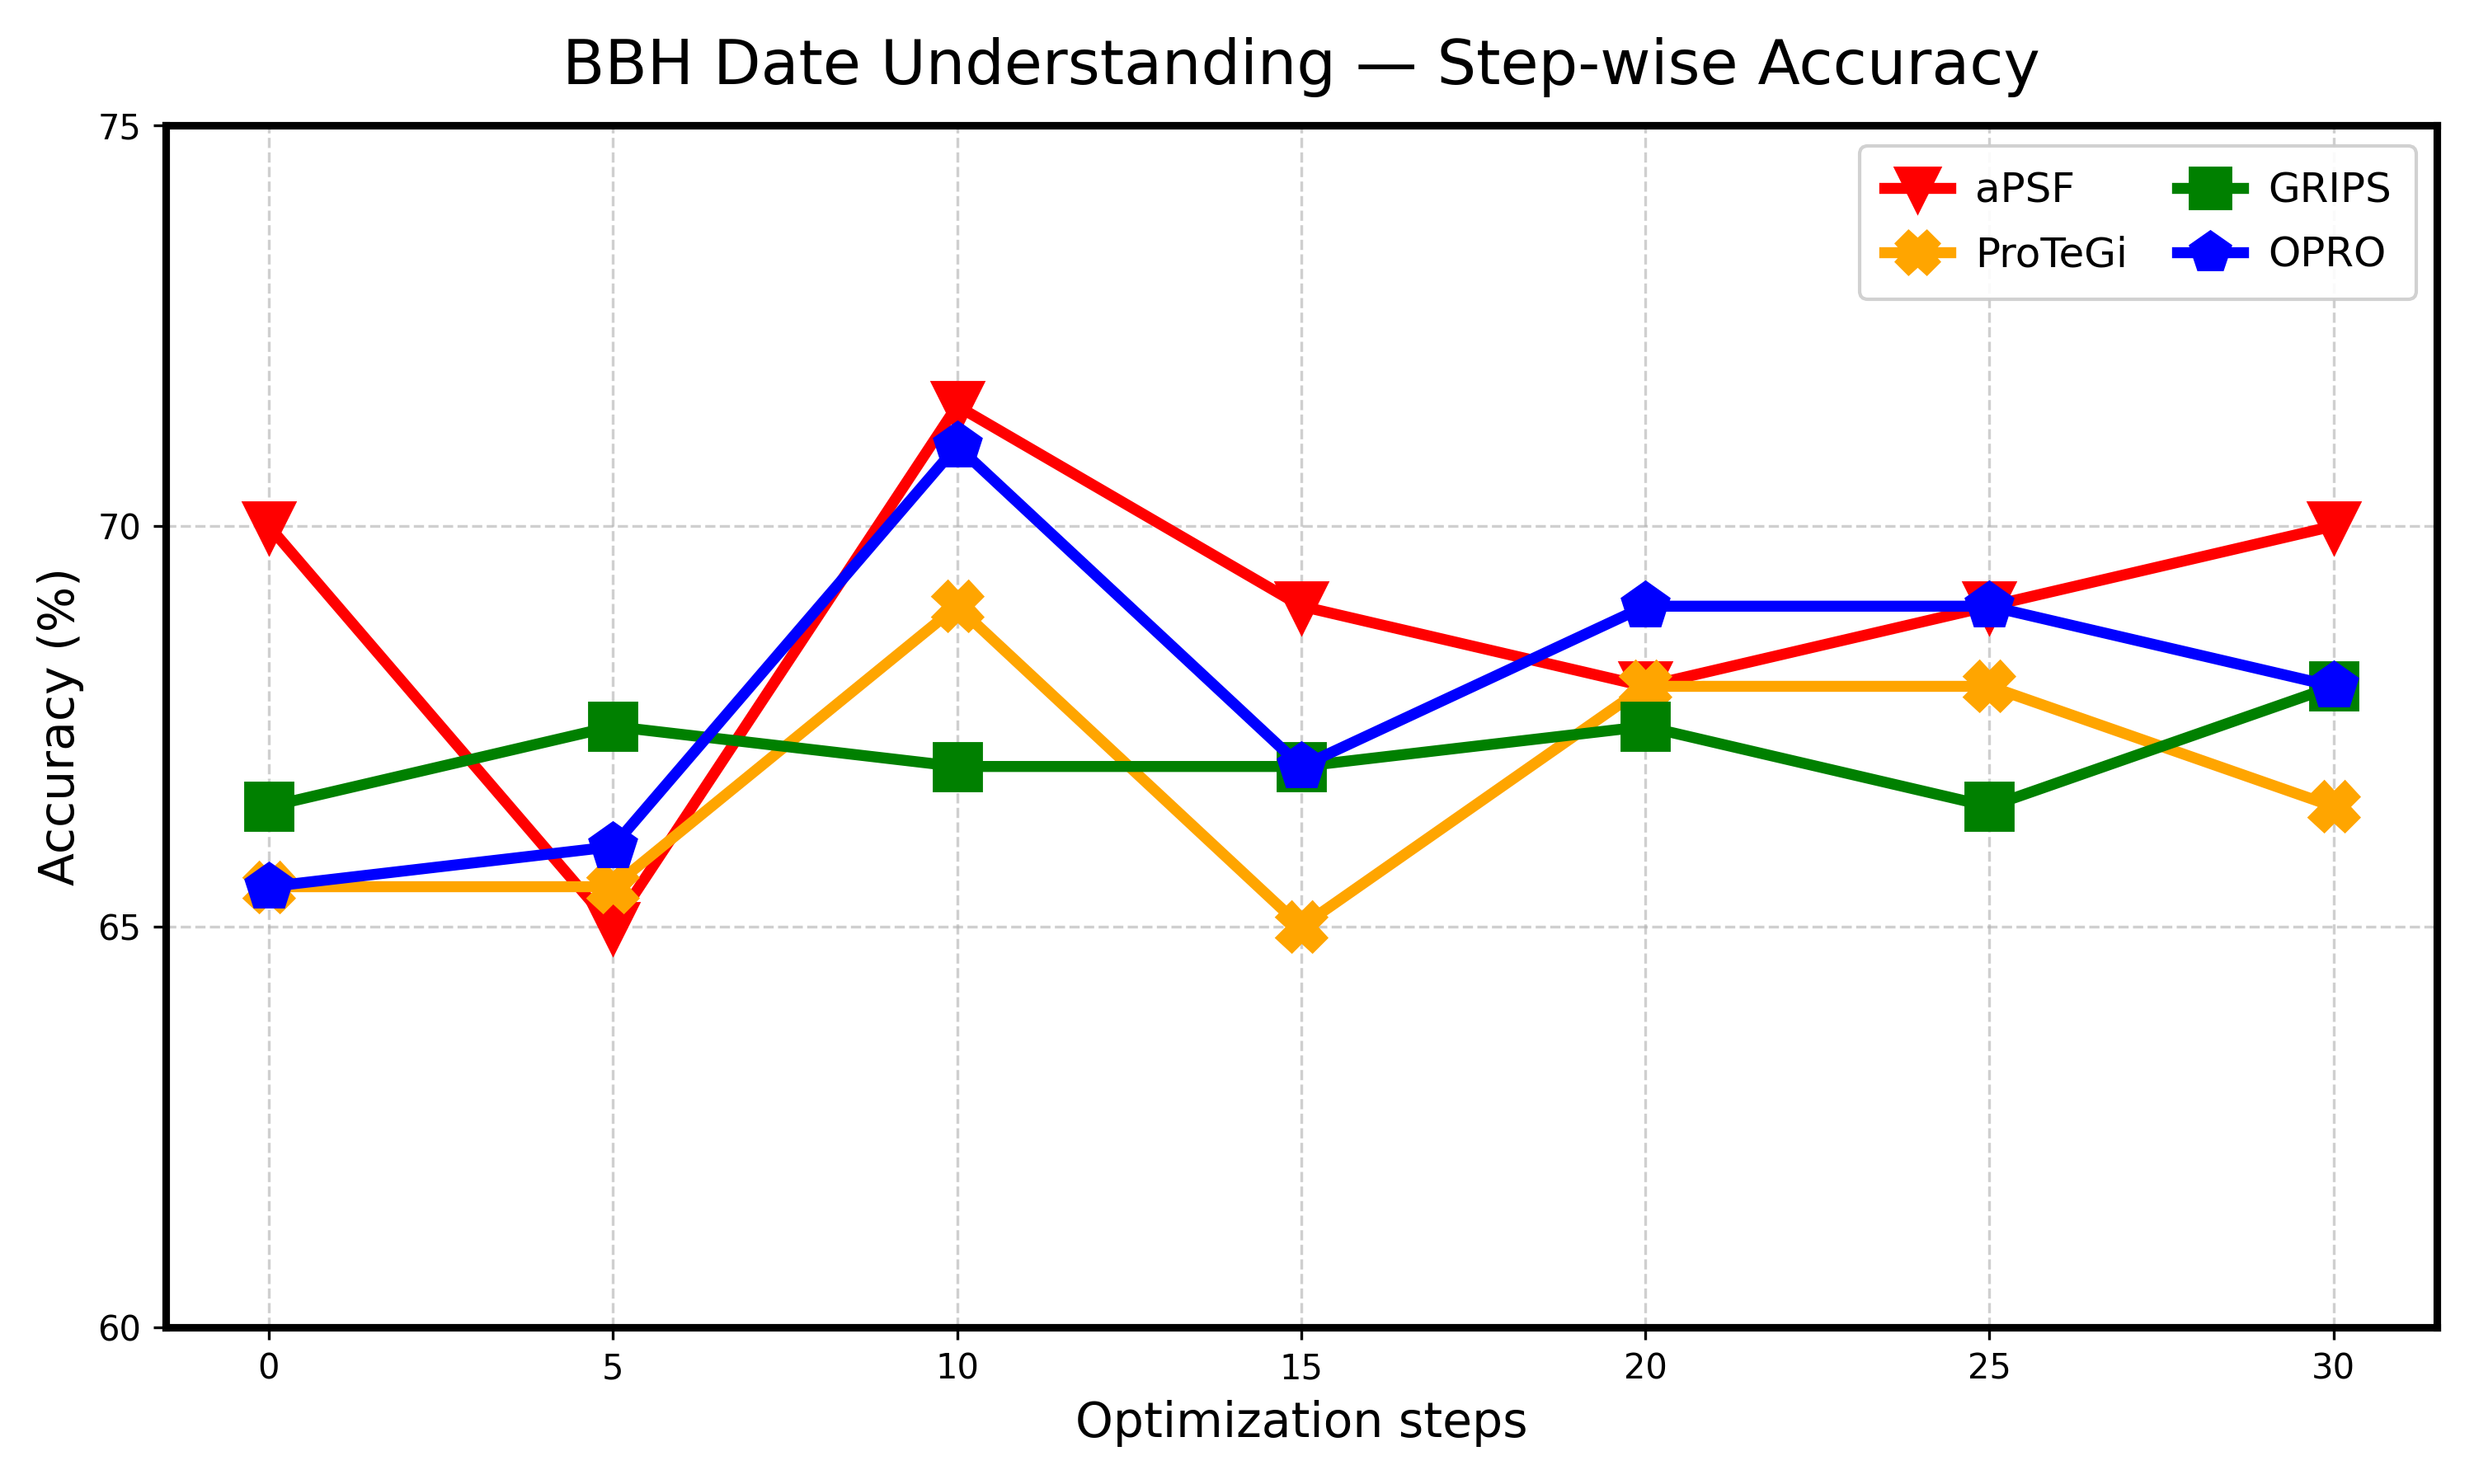
The chart visualizes the accuracy trends of four algorithms (aPSF, GRIPS, ProTeGi, OPRO) across 30 optimization steps. Accuracy is measured in percentage, with values ranging from 60% to 75%. Each algorithm is represented by a distinct line and marker type, with trends showing variability in performance over steps.
### Components/Axes
- **X-axis**: "Optimization steps" (0 to 30, increments of 5).
- **Y-axis**: "Accuracy (%)" (60% to 75%, increments of 5%).
- **Legend**: Located in the top-right corner, mapping colors/markers to algorithms:
- Red triangles: aPSF
- Green squares: GRIPS
- Yellow crosses: ProTeGi
- Blue diamonds: OPRO
### Detailed Analysis
1. **aPSF (Red Triangles)**:
- Starts at ~70% (step 0), drops to ~65% (step 5), peaks at ~72% (step 10), then declines to ~68% (step 15), stabilizes at ~67% (step 20), rises to ~68% (step 25), and ends at ~70% (step 30).
- **Trend**: V-shaped with a peak at step 10.
2. **GRIPS (Green Squares)**:
- Starts at ~66% (step 0), rises to ~67% (step 5), remains stable (~67%) until step 10, dips to ~66.5% (step 15), increases to ~67.5% (step 20), drops to ~66.5% (step 25), and ends at ~67.5% (step 30).
- **Trend**: Relatively flat with minor fluctuations.
3. **ProTeGi (Yellow Crosses)**:
- Starts at ~65.5% (step 0), drops to ~65% (step 5), peaks at ~68.5% (step 10), plunges to ~65% (step 15), rises to ~67.5% (step 20), stabilizes at ~67.5% (step 25), and ends at ~66.5% (step 30).
- **Trend**: Sharp dip at step 15, followed by recovery.
4. **OPRO (Blue Diamonds)**:
- Starts at ~65.5% (step 0), rises to ~66% (step 5), peaks at ~71% (step 10), declines to ~66.5% (step 15), increases to ~68.5% (step 20), stabilizes at ~68.5% (step 25), and ends at ~67.5% (step 30).
- **Trend**: Sharp rise to step 10, followed by volatility.
### Key Observations
- **aPSF** and **OPRO** exhibit the highest accuracy peaks (~72% and ~71%, respectively) at step 10.
- **ProTeGi** shows the lowest accuracy (~65%) at step 15, indicating a significant dip.
- **GRIPS** maintains the most stable performance, with minimal fluctuations (~66–67.5%).
- All algorithms converge toward ~67–68% accuracy by step 30, except **aPSF**, which recovers to ~70%.
### Interpretation
The data suggests that **aPSF** and **OPRO** perform optimally in early optimization steps (peaking at step 10), while **ProTeGi** struggles with a mid-step decline. **GRIPS** demonstrates consistent reliability, making it a stable choice. The convergence of accuracies by step 30 implies diminishing returns or stabilization in later steps. The sharp dip in **ProTeGi** at step 15 may indicate sensitivity to specific optimization conditions. Overall, the chart highlights trade-offs between early performance gains and long-term stability across algorithms.