## Heatmap: Classification accuracies
### Overview
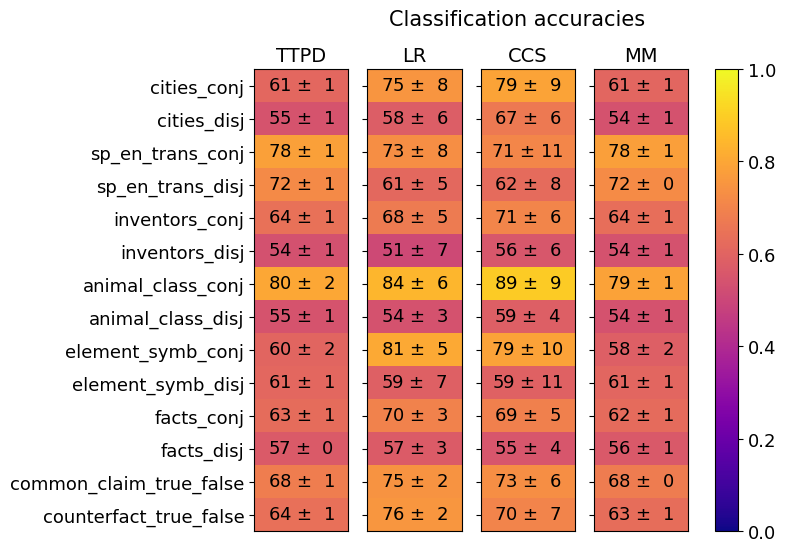
The image is a heatmap comparing classification accuracies across 12 different tasks/datasets and 4 methods (TTPD, LR, CCS, MM). Values are represented as percentages with standard deviations (±), using a color gradient from purple (low accuracy) to yellow (high accuracy). The legend on the right maps colors to numerical values (0.0–1.0).
### Components/Axes
- **Y-axis (Tasks/Datasets)**:
- cities_conj, cities_disj
- sp_en_trans_conj, sp_en_trans_disj
- inventors_conj, inventors_disj
- animal_class_conj, animal_class_disj
- element_symb_conj, element_symb_disj
- facts_conj, facts_disj
- common_claim_true_false, counterfact_true_false
- **X-axis (Methods)**: TTPD, LR, CCS, MM
- **Legend**: Color gradient from purple (0.0) to yellow (1.0), with intermediate values (0.2, 0.4, 0.6, 0.8).
### Detailed Analysis
- **cities_conj**:
- TTPD: 61 ± 1 (orange)
- LR: 75 ± 8 (orange)
- CCS: 79 ± 9 (yellow)
- MM: 61 ± 1 (orange)
- **cities_disj**:
- TTPD: 55 ± 1 (red)
- LR: 58 ± 6 (red)
- CCS: 67 ± 6 (orange)
- MM: 54 ± 1 (red)
- **sp_en_trans_conj**:
- TTPD: 78 ± 1 (yellow)
- LR: 73 ± 8 (orange)
- CCS: 71 ± 11 (orange)
- MM: 78 ± 1 (yellow)
- **sp_en_trans_disj**:
- TTPD: 72 ± 1 (orange)
- LR: 61 ± 5 (red)
- CCS: 62 ± 8 (red)
- MM: 72 ± 0 (orange)
- **inventors_conj**:
- TTPD: 64 ± 1 (orange)
- LR: 68 ± 5 (orange)
- CCS: 71 ± 6 (orange)
- MM: 64 ± 1 (orange)
- **inventors_disj**:
- TTPD: 54 ± 1 (red)
- LR: 51 ± 7 (red)
- CCS: 56 ± 6 (red)
- MM: 54 ± 1 (red)
- **animal_class_conj**:
- TTPD: 80 ± 2 (yellow)
- LR: 84 ± 6 (yellow)
- CCS: 89 ± 9 (bright yellow)
- MM: 79 ± 1 (yellow)
- **animal_class_disj**:
- TTPD: 55 ± 1 (red)
- LR: 54 ± 3 (red)
- CCS: 59 ± 4 (red)
- MM: 54 ± 1 (red)
- **element_symb_conj**:
- TTPD: 60 ± 2 (red)
- LR: 81 ± 5 (orange)
- CCS: 79 ± 10 (orange)
- MM: 58 ± 2 (red)
- **element_symb_disj**:
- TTPD: 61 ± 1 (orange)
- LR: 59 ± 7 (red)
- CCS: 59 ± 11 (red)
- MM: 61 ± 1 (orange)
- **facts_conj**:
- TTPD: 63 ± 1 (orange)
- LR: 70 ± 3 (orange)
- CCS: 69 ± 5 (orange)
- MM: 62 ± 1 (orange)
- **facts_disj**:
- TTPD: 57 ± 0 (red)
- LR: 57 ± 3 (red)
- CCS: 55 ± 4 (red)
- MM: 56 ± 1 (red)
- **common_claim_true_false**:
- TTPD: 68 ± 1 (orange)
- LR: 75 ± 2 (orange)
- CCS: 73 ± 6 (orange)
- MM: 68 ± 0 (orange)
- **counterfact_true_false**:
- TTPD: 64 ± 1 (orange)
- LR: 76 ± 2 (orange)
- CCS: 70 ± 7 (orange)
- MM: 63 ± 1 (orange)
### Key Observations
1. **CCS dominates in animal_class_conj**: Achieves the highest accuracy (89 ± 9) with bright yellow shading, far exceeding other methods.
2. **TTPD and MM parity**: These methods show similar performance across most tasks (e.g., cities_conj, sp_en_trans_conj).
3. **LR underperforms in disjunctive tasks**: Lower accuracies for disjunctive categories (e.g., cities_disj, inventors_disj) compared to conjunctive ones.
4. **CCS variability**: High standard deviations in some tasks (e.g., sp_en_trans_conj: ±11) suggest instability.
5. **MM consistency**: Lowest standard deviations (e.g., sp_en_trans_disj: ±0) indicate stable performance.
### Interpretation
The data demonstrates that **CCS** is the most accurate method overall, particularly for conjunctive tasks like `animal_class_conj` and `sp_en_trans_conj`. However, its performance degrades in disjunctive tasks (e.g., `element_symb_disj`). **TTPD** and **MM** show comparable results but lag behind CCS in critical areas. **LR** struggles with disjunctive logic, suggesting limitations in handling negated or exclusive conditions. The standard deviations highlight that CCS’s high accuracy in `animal_class_conj` may come with higher variability, while MM’s consistency (e.g., ±0 in `sp_en_trans_disj`) makes it reliable for specific use cases. The heatmap underscores the importance of method selection based on task structure (conjunctive vs. disjunctive).