## Heatmap: Classification Accuracies
### Overview
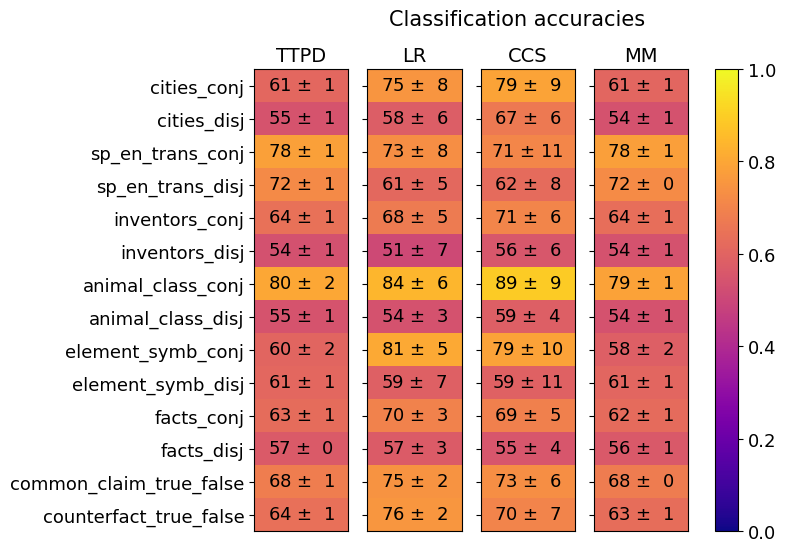
The image is a heatmap displaying classification accuracies for different models (TTPD, LR, CCS, MM) across various categories (cities_conj, cities_disj, etc.). The heatmap uses a color gradient from dark blue (low accuracy) to bright yellow (high accuracy) to represent the accuracy values. Each cell contains the accuracy value and its associated uncertainty (± value).
### Components/Axes
* **Title:** Classification accuracies
* **Columns (Models):** TTPD, LR, CCS, MM
* **Rows (Categories):** cities\_conj, cities\_disj, sp\_en\_trans\_conj, sp\_en\_trans\_disj, inventors\_conj, inventors\_disj, animal\_class\_conj, animal\_class\_disj, element\_symb\_conj, element\_symb\_disj, facts\_conj, facts\_disj, common\_claim\_true\_false, counterfact\_true\_false
* **Colorbar:** Ranges from 0.0 (dark blue) to 1.0 (bright yellow), representing the classification accuracy score.
### Detailed Analysis or ### Content Details
Here's a breakdown of the accuracy values for each model and category:
* **TTPD:**
* cities\_conj: 61 ± 1
* cities\_disj: 55 ± 1
* sp\_en\_trans\_conj: 78 ± 1
* sp\_en\_trans\_disj: 72 ± 1
* inventors\_conj: 64 ± 1
* inventors\_disj: 54 ± 1
* animal\_class\_conj: 80 ± 2
* animal\_class\_disj: 55 ± 1
* element\_symb\_conj: 60 ± 2
* element\_symb\_disj: 61 ± 1
* facts\_conj: 63 ± 1
* facts\_disj: 57 ± 0
* common\_claim\_true\_false: 68 ± 1
* counterfact\_true\_false: 64 ± 1
* **LR:**
* cities\_conj: 75 ± 8
* cities\_disj: 58 ± 6
* sp\_en\_trans\_conj: 73 ± 8
* sp\_en\_trans\_disj: 61 ± 5
* inventors\_conj: 68 ± 5
* inventors\_disj: 51 ± 7
* animal\_class\_conj: 84 ± 6
* animal\_class\_disj: 54 ± 3
* element\_symb\_conj: 81 ± 5
* element\_symb\_disj: 59 ± 7
* facts\_conj: 70 ± 3
* facts\_disj: 57 ± 3
* common\_claim\_true\_false: 75 ± 2
* counterfact\_true\_false: 76 ± 2
* **CCS:**
* cities\_conj: 79 ± 9
* cities\_disj: 67 ± 6
* sp\_en\_trans\_conj: 71 ± 11
* sp\_en\_trans\_disj: 62 ± 8
* inventors\_conj: 71 ± 6
* inventors\_disj: 56 ± 6
* animal\_class\_conj: 89 ± 9
* animal\_class\_disj: 59 ± 4
* element\_symb\_conj: 79 ± 10
* element\_symb\_disj: 59 ± 11
* facts\_conj: 69 ± 5
* facts\_disj: 55 ± 4
* common\_claim\_true\_false: 73 ± 6
* counterfact\_true\_false: 70 ± 7
* **MM:**
* cities\_conj: 61 ± 1
* cities\_disj: 54 ± 1
* sp\_en\_trans\_conj: 78 ± 1
* sp\_en\_trans\_disj: 72 ± 0
* inventors\_conj: 64 ± 1
* inventors\_disj: 54 ± 1
* animal\_class\_conj: 79 ± 1
* animal\_class\_disj: 54 ± 1
* element\_symb\_conj: 58 ± 2
* element\_symb\_disj: 61 ± 1
* facts\_conj: 62 ± 1
* facts\_disj: 56 ± 1
* common\_claim\_true\_false: 68 ± 0
* counterfact\_true\_false: 63 ± 1
### Key Observations
* The `animal_class_conj` category generally has high accuracy across all models, with CCS achieving the highest at 89 ± 9.
* The `cities_disj` and `inventors_disj` categories tend to have lower accuracy scores compared to other categories across all models.
* CCS generally has higher accuracy scores compared to the other models, especially for `animal_class_conj`.
* MM has the lowest accuracy for `element_symb_conj` at 58 ± 2.
### Interpretation
The heatmap provides a visual comparison of the classification accuracies of four different models across various categories. The color gradient allows for quick identification of high and low performance areas. The data suggests that some categories are inherently easier to classify than others, as evidenced by the consistently high or low scores across all models. The CCS model appears to perform better overall, particularly in the `animal_class_conj` category. The uncertainty values (±) provide a measure of the variability in the accuracy scores, which should be considered when comparing the models. The heatmap highlights the strengths and weaknesses of each model for different types of classification tasks.