## Heatmap: Classification Accuracies
### Overview
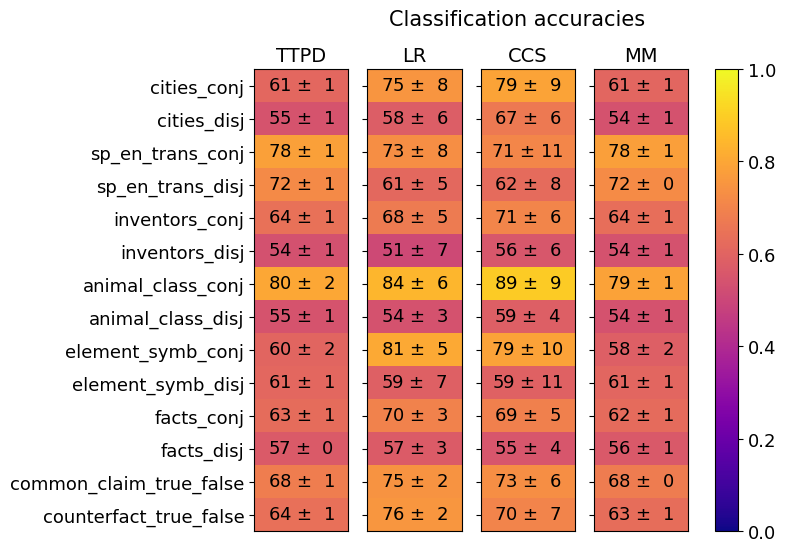
The image is a heatmap titled "Classification accuracies" that compares the performance of four different models (TTPD, LR, CCS, MM) across fourteen distinct classification tasks. The performance metric is accuracy, presented as a mean value with an associated uncertainty (standard deviation or error). The data is encoded using a color gradient, with a corresponding color bar scale on the right side of the chart.
### Components/Axes
* **Chart Title:** "Classification accuracies" (top center).
* **Column Headers (Models):** Four models are listed horizontally across the top:
* TTPD
* LR
* CCS
* MM
* **Row Labels (Tasks):** Fourteen tasks are listed vertically on the left side:
1. cities_conj
2. cities_disj
3. sp_en_trans_conj
4. sp_en_trans_disj
5. inventors_conj
6. inventors_disj
7. animal_class_conj
8. animal_class_disj
9. element_symb_conj
10. element_symb_disj
11. facts_conj
12. facts_disj
13. common_claim_true_false
14. counterfact_true_false
* **Color Bar/Legend:** Positioned vertically on the far right. It maps color to accuracy values on a scale from 0.0 (dark purple) to 1.0 (bright yellow). Key markers are at 0.0, 0.2, 0.4, 0.6, 0.8, and 1.0.
* **Data Cells:** Each cell in the grid contains a numerical value in the format "mean ± uncertainty". The background color of each cell corresponds to its mean accuracy value according to the color bar.
### Detailed Analysis
The following table reconstructs the data from the heatmap. Values are transcribed exactly as shown.
| Task | TTPD Accuracy | LR Accuracy | CCS Accuracy | MM Accuracy |
| :--- | :--- | :--- | :--- | :--- |
| cities_conj | 61 ± 1 | 75 ± 8 | 79 ± 9 | 61 ± 1 |
| cities_disj | 55 ± 1 | 58 ± 6 | 67 ± 6 | 54 ± 1 |
| sp_en_trans_conj | 78 ± 1 | 73 ± 8 | 71 ± 11 | 78 ± 1 |
| sp_en_trans_disj | 72 ± 1 | 61 ± 5 | 62 ± 8 | 72 ± 0 |
| inventors_conj | 64 ± 1 | 68 ± 5 | 71 ± 6 | 64 ± 1 |
| inventors_disj | 54 ± 1 | 51 ± 7 | 56 ± 6 | 54 ± 1 |
| animal_class_conj | 80 ± 2 | 84 ± 6 | 89 ± 9 | 79 ± 1 |
| animal_class_disj | 55 ± 1 | 54 ± 3 | 59 ± 4 | 54 ± 1 |
| element_symb_conj | 60 ± 2 | 81 ± 5 | 79 ± 10 | 58 ± 2 |
| element_symb_disj | 61 ± 1 | 59 ± 7 | 59 ± 11 | 61 ± 1 |
| facts_conj | 63 ± 1 | 70 ± 3 | 69 ± 5 | 62 ± 1 |
| facts_disj | 57 ± 0 | 57 ± 3 | 55 ± 4 | 56 ± 1 |
| common_claim_true_false | 68 ± 1 | 75 ± 2 | 73 ± 6 | 68 ± 0 |
| counterfact_true_false | 64 ± 1 | 76 ± 2 | 70 ± 7 | 63 ± 1 |
**Visual Trend Verification:**
* **Color Trend:** The heatmap shows a clear pattern where cells for "conj" (conjunctive) tasks are generally lighter (more yellow/orange, indicating higher accuracy) than their "disj" (disjunctive) counterparts, which are darker (more purple/red).
* **Model Trend:** The LR and CCS columns contain the brightest cells overall, suggesting they achieve the highest peak accuracies on several tasks. The TTPD and MM columns are more uniformly colored in the mid-range (orange/red).
### Key Observations
1. **Task Difficulty:** "animal_class_conj" is the easiest task, with accuracies ranging from 79% to 89%. "inventors_disj" and "animal_class_disj" appear to be among the hardest, with most accuracies in the low-to-mid 50s.
2. **Conjunctive vs. Disjunctive:** For every task pair (e.g., cities_conj vs. cities_disj), the conjunctive version has a higher mean accuracy than the disjunctive version across all models. This is a consistent and strong pattern.
3. **Model Performance:**
* **LR** achieves the single highest accuracy on the chart: 89 ± 9 on "animal_class_conj". It also performs very well on "element_symb_conj" (81 ± 5).
* **CCS** shows high performance but with notably larger uncertainty ranges (e.g., 71 ± 11, 79 ± 10), suggesting less consistent results across runs or folds.
* **TTPD** and **MM** have very similar performance profiles, often with identical or nearly identical mean accuracies and low uncertainties (±0 or ±1). Their performance is stable but generally not the highest.
4. **Notable Outliers:** The "sp_en_trans" tasks show an interesting reversal. For the conjunctive version, TTPD and MM (78 ± 1) outperform LR and CCS. For the disjunctive version, TTPD and MM (72 ± 0/1) again outperform LR and CCS. This is the only task family where this pattern occurs.
### Interpretation
This heatmap provides a comparative analysis of model robustness across different types of logical or factual classification tasks. The data suggests several key insights:
1. **Task Structure is a Primary Determinant of Performance:** The consistent performance gap between conjunctive ("and") and disjunctive ("or") tasks indicates that reasoning about conjunctions is fundamentally easier for these models than reasoning about disjunctions. This could be due to the nature of the training data or the inherent complexity of the logical operations.
2. **Model Specialization:** No single model dominates all tasks. LR and CCS achieve the highest peak accuracies, but with greater variance (higher uncertainty). TTPD and MM offer more consistent, reliable performance, albeit at a slightly lower ceiling. This presents a trade-off between peak performance and stability.
3. **Domain-Specific Strengths:** The outlier in the "sp_en_trans" (likely Spanish-English translation) tasks suggests that TTPD and MM may have an architectural or training advantage for this specific type of linguistic or translational reasoning, which differs from their performance on other knowledge-based tasks (like cities, inventors, elements).
4. **Investigative Reading:** The high uncertainty in CCS's scores (e.g., ±11) warrants further investigation. It could indicate sensitivity to initialization, data splits, or a less stable optimization process. Conversely, the very low uncertainty in TTPD and MM scores suggests highly reproducible results. The choice between models, therefore, depends on the application's need for either maximum potential accuracy (favoring LR/CCS) or guaranteed consistent performance (favoring TTPD/MM).