# Technical Document Extraction: Line Graph Analysis
## 1. Labels and Axis Titles
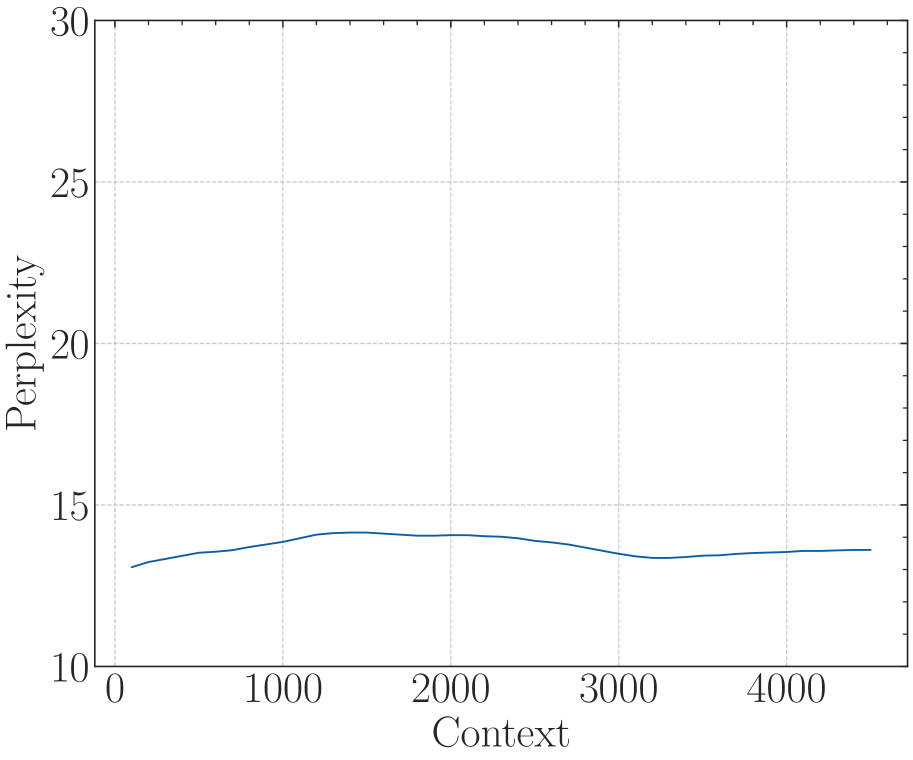
- **Y-Axis Label**: "Perplexity" (ranging from 10 to 30 in increments of 5).
- **X-Axis Label**: "Context" (ranging from 0 to 4000 in increments of 1000).
- **Grid**: Dotted lines forming a Cartesian grid.
- **Legend**: Absent in the image.
## 2. Key Trends
- The blue line exhibits a **non-linear trend** with fluctuations:
- **Initial Rise**: Starts at ~12, increases to ~14 by x=1000.
- **Peak**: Reaches ~14.5 at x=2000.
- **Decline**: Drops to ~13.5 at x=3000.
- **Stabilization**: Fluctuates between ~13.5 and ~14 from x=3000 to x=4000.
## 3. Data Points (Approximate)
| X-Value | Y-Value (Perplexity) | Notes |
|---------|----------------------|---------------------------|
| 0 | ~12 | Starting point |
| 1000 | ~14 | First local maximum |
| 2000 | ~14.5 | Global maximum |
| 3000 | ~13.5 | Local minimum |
| 4000 | ~13.7 | Final stabilized value |
## 4. Component Isolation
- **Header**: No explicit header text.
- **Main Chart**:
- Blue line dominates the plot.
- Grid lines are evenly spaced (x: 1000 units, y: 5 units).
- **Footer**: No footer text or annotations.
## 5. Trend Verification
- **Visual Confirmation**:
- The line slopes upward from x=0 to x=1000, then plateaus with minor oscillations until x=2000.
- A gradual decline occurs between x=2000 and x=3000, followed by stabilization.
- **Numerical Consistency**: Data points align with the visual trend (e.g., peak at x=2000 matches the highest y-value).
## 6. Spatial Grounding
- **Legend Placement**: Not applicable (no legend present).
- **Line Color**: Blue, consistent throughout the plot.
## 7. Additional Observations
- No embedded text, data tables, or secondary diagrams.
- The graph focuses solely on the relationship between "Context" (x-axis) and "Perplexity" (y-axis).
## 8. Conclusion
The graph illustrates a fluctuating relationship between context size and perplexity, with a peak at x=2000 and stabilization beyond x=3000. No additional textual or categorical data is present.