## Phase Portrait: System Dynamics
### Overview
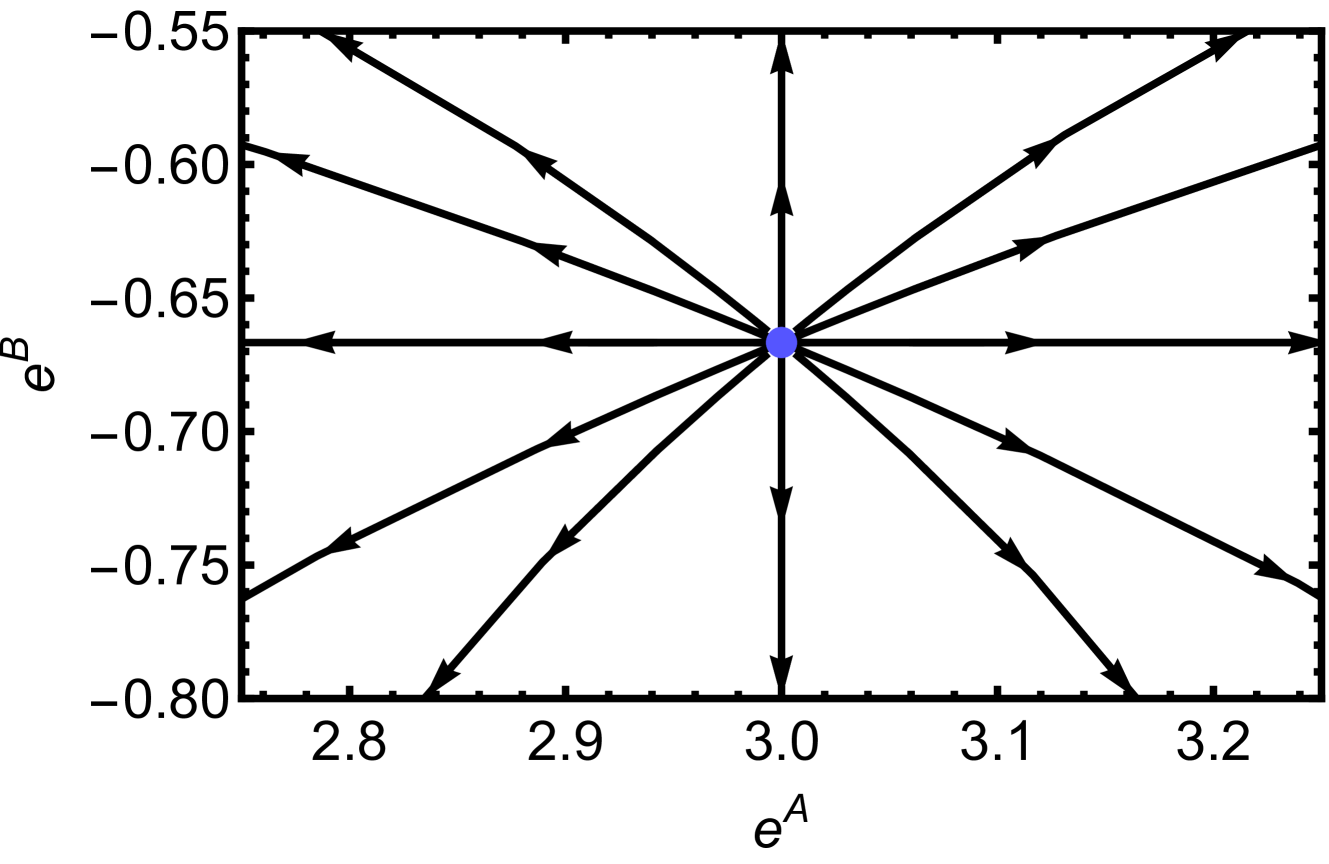
The image is a phase portrait, depicting the dynamics of a system in a two-dimensional space. The axes represent variables e^A and e^B. The plot shows trajectories (paths) with arrows indicating the direction of movement in the phase space. A blue dot marks a fixed point or equilibrium.
### Components/Axes
* **X-axis:** e^A, ranging from 2.8 to 3.2 in increments of 0.1.
* **Y-axis:** e^B, ranging from -0.80 to -0.55 in increments of 0.05.
* **Trajectories:** Black lines with arrows indicating the direction of movement.
* **Fixed Point:** A blue dot located at approximately (3.0, -0.67).
### Detailed Analysis
The phase portrait shows several trajectories converging towards a central point.
* **Trajectories from the left:** Start at e^A values less than 3.0 and move towards the right, converging towards the blue dot.
* **Trajectories from the right:** Start at e^A values greater than 3.0 and move towards the left, converging towards the blue dot.
* **Trajectories from above:** Start at e^B values greater than -0.67 and move downwards, converging towards the blue dot.
* **Trajectories from below:** Start at e^B values less than -0.67 and move upwards, converging towards the blue dot.
* **Horizontal trajectories:** Start at e^B = -0.67 and move horizontally towards the right or left, converging towards the blue dot.
### Key Observations
* All trajectories converge towards the blue dot, indicating a stable equilibrium point.
* The system exhibits a saddle-node bifurcation or a stable node behavior around the fixed point.
### Interpretation
The phase portrait illustrates the behavior of a dynamical system where all initial states eventually lead to a stable equilibrium at the point (3.0, -0.67). This suggests that the system is self-correcting and will return to this equilibrium state regardless of its initial condition. The arrows indicate the direction of change, and the convergence towards the blue dot signifies stability.