\n
## Diagram: Vector Field Plot
### Overview
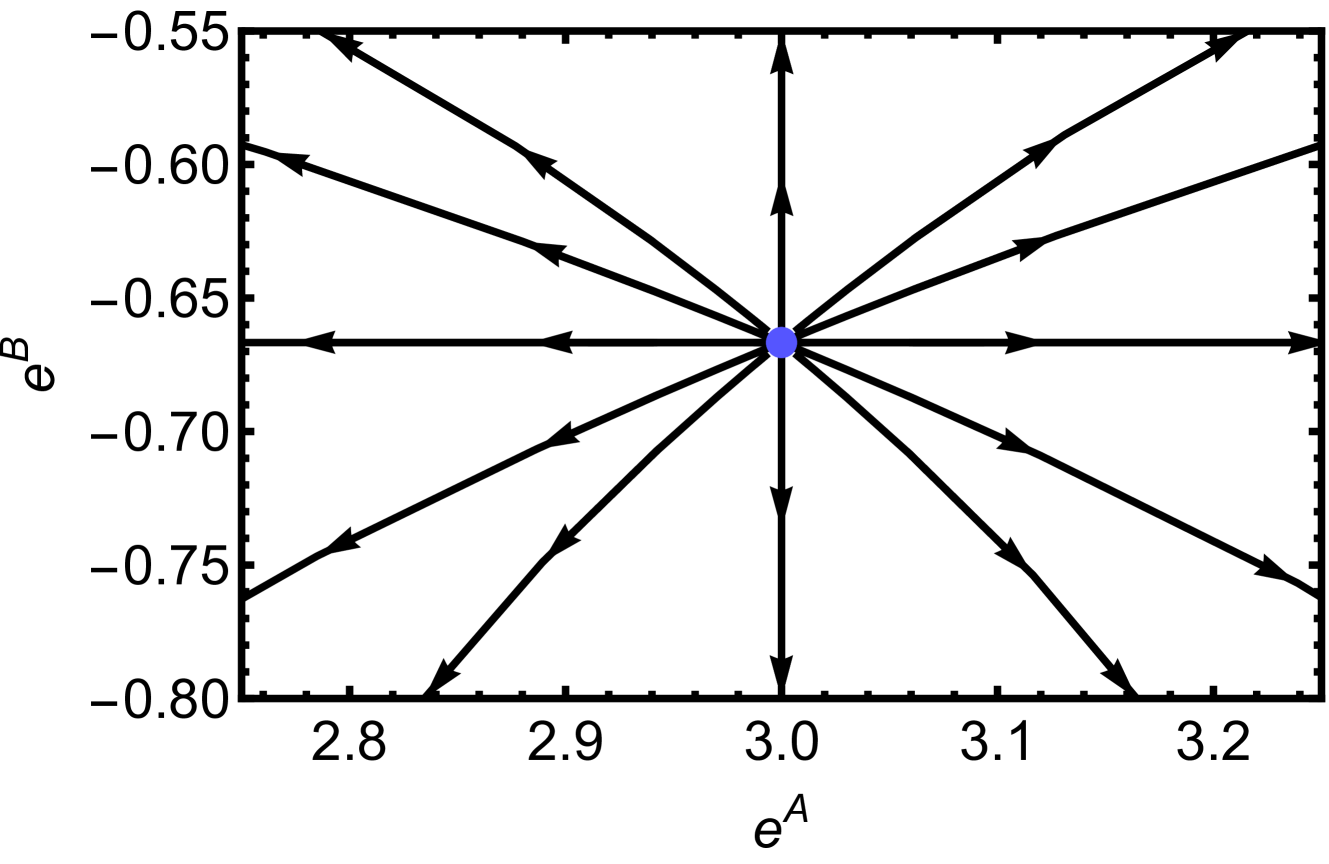
The image depicts a vector field plot in a two-dimensional space. The axes are labeled with exponential terms, and arrows represent the direction and magnitude of the vector field at various points. A central point, marked with a blue circle, appears to be a fixed point or equilibrium.
### Components/Axes
* **X-axis:** Labeled "e<sup>A</sup>", ranging from approximately 2.8 to 3.2, with increments of 0.1.
* **Y-axis:** Labeled "e<sup>B</sup>", ranging from approximately -0.80 to -0.55, with increments of 0.05.
* **Vectors:** Numerous arrows originating from various points within the defined range.
* **Fixed Point:** A blue circle located near the center of the plot, at approximately (3.0, -0.67).
### Detailed Analysis
The vectors appear to radiate outwards from the central blue point.
* **Vectors above the fixed point (e<sup>B</sup> > -0.67):** Generally point upwards and slightly outwards.
* **Vectors below the fixed point (e<sup>B</sup> < -0.67):** Generally point downwards and slightly outwards.
* **Vectors to the left of the fixed point (e<sup>A</sup> < 3.0):** Point towards the right and either upwards or downwards, depending on the value of e<sup>B</sup>.
* **Vectors to the right of the fixed point (e<sup>A</sup> > 3.0):** Point towards the left and either upwards or downwards, depending on the value of e<sup>B</sup>.
The magnitude of the vectors appears relatively consistent across the plot, with no significant variations in arrow length.
### Key Observations
* The central blue point acts as a source or sink for the vectors, suggesting a stable equilibrium.
* The vector field exhibits radial symmetry around the fixed point.
* The plot does not contain any numerical data beyond the axis labels.
### Interpretation
The diagram likely represents a dynamical system where the state of the system is defined by two variables, A and B. The vector field indicates the rate of change of these variables at each point in the (A, B) plane. The fixed point suggests that if the system starts at that point, it will remain there indefinitely. The radial symmetry indicates that the system is stable, and any small perturbation from the fixed point will cause the system to return to it. The exponential scaling on the axes suggests that the underlying equations governing the system may involve exponential functions.
The diagram is a qualitative representation of the system's behavior, providing insights into its stability and equilibrium points. Without the underlying equations, it is difficult to determine the exact nature of the system or its long-term behavior.