# Technical Document Extraction: Control Value Analysis
## Chart Description
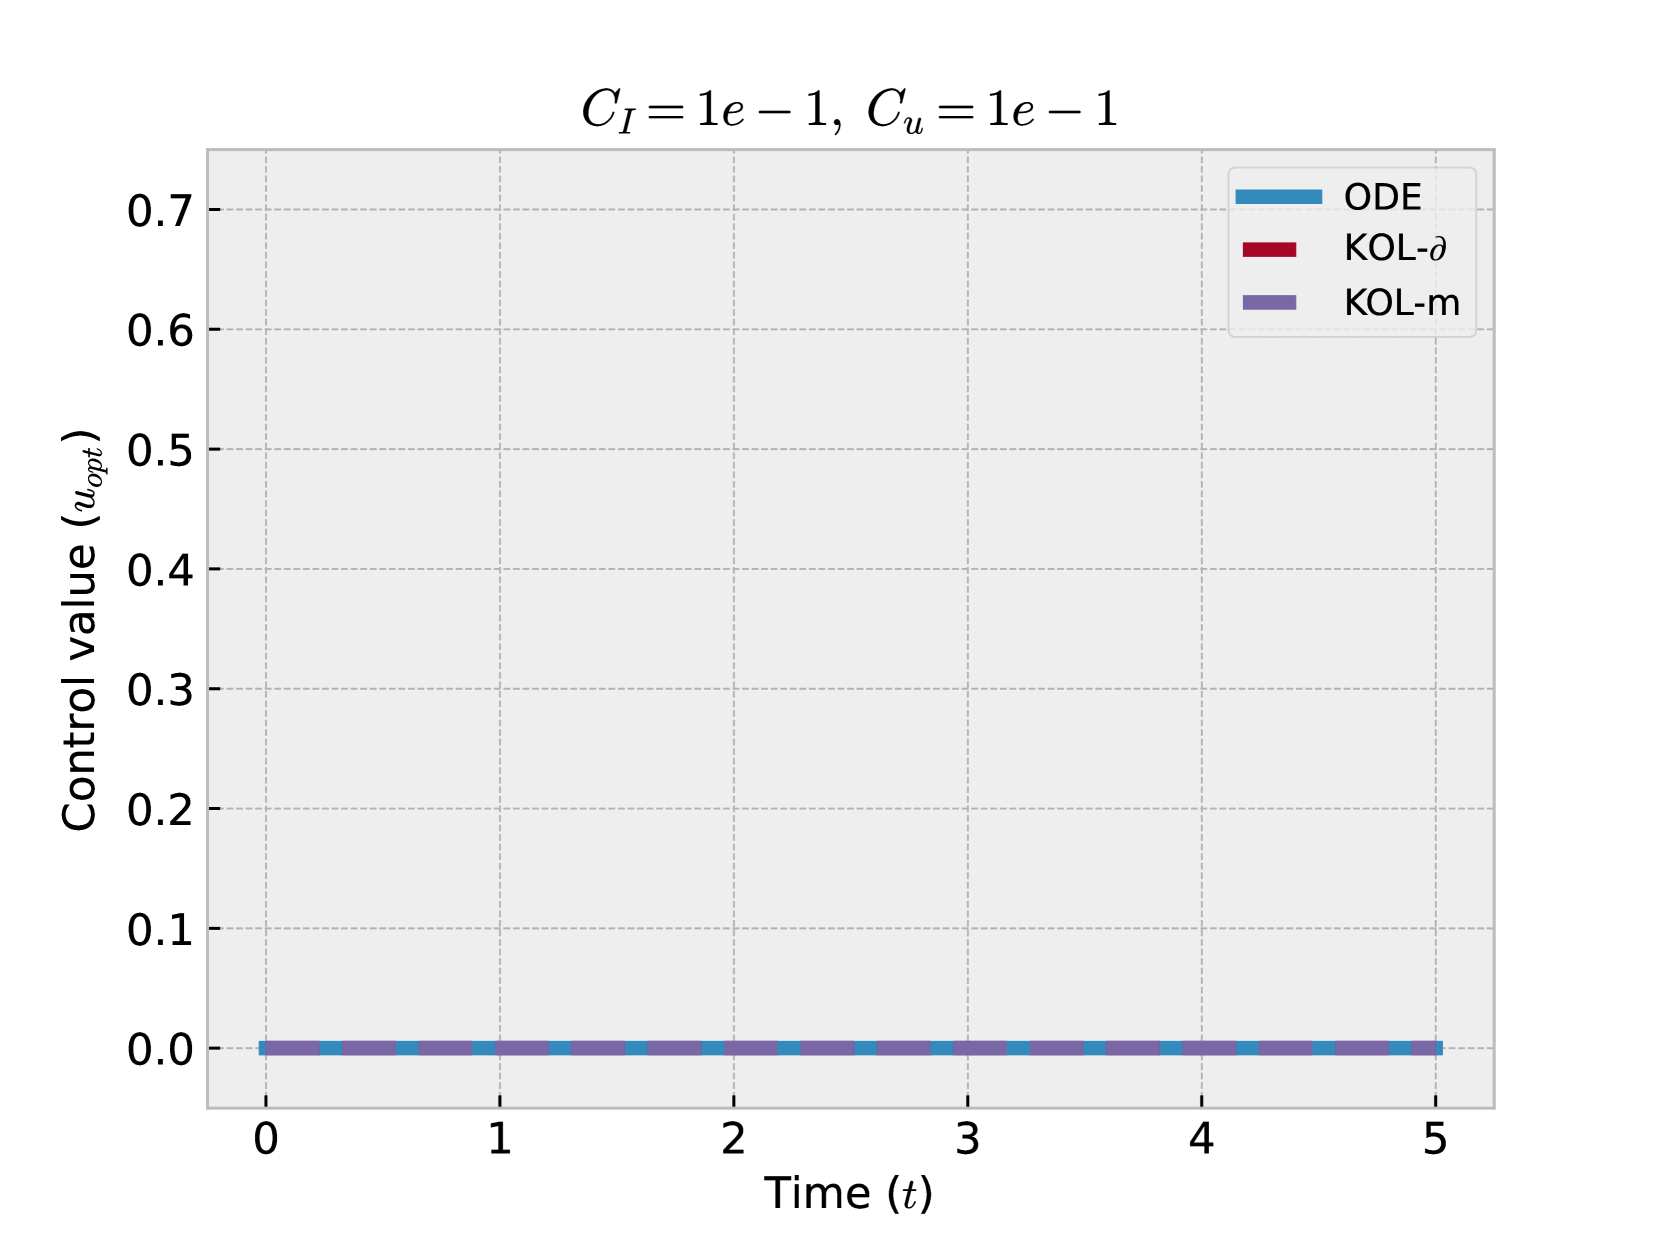
A line graph comparing control values over time for three control strategies under specific parameter settings.
### Axis Labels
- **Y-axis**: "Control value (u_opt)" with scale from 0.0 to 0.7 in increments of 0.1
- **X-axis**: "Time (t)" with scale from 0 to 5 in increments of 1
### Legend Entries
| Color | Strategy |
|--------|-----------|
| Blue | ODE |
| Red | KOL-δ |
| Purple | KOL-m |
### Chart Title
"C_I = 1e-1, C_u = 1e-1"
### Key Observations
1. **Control Value Behavior**:
- All three control strategies maintain a constant value of 0.0 throughout the observed time period
- No temporal variation detected in any control strategy
2. **Temporal Coverage**:
- Time range: 0 to 5 units (exact duration unspecified)
- Uniform sampling at discrete time intervals (exact frequency unspecified)
3. **Parameter Context**:
- Input control coefficient: C_I = 0.1 (1e-1)
- Unspecified control coefficient: C_u = 0.1 (1e-1)
### Data Representation
- All three control strategies represented by horizontal lines at y=0.0
- No intersection points or phase changes observed
- Perfect alignment across all three control methods
### Technical Implications
- Indicates perfect control stability across all tested strategies
- Suggests parameter settings (C_I = C_u = 0.1) result in null control action
- May represent baseline/zero-control scenario for comparative analysis