# Technical Analysis: Llama 33B, A100 80GB PCIe Performance Chart
## Chart Overview
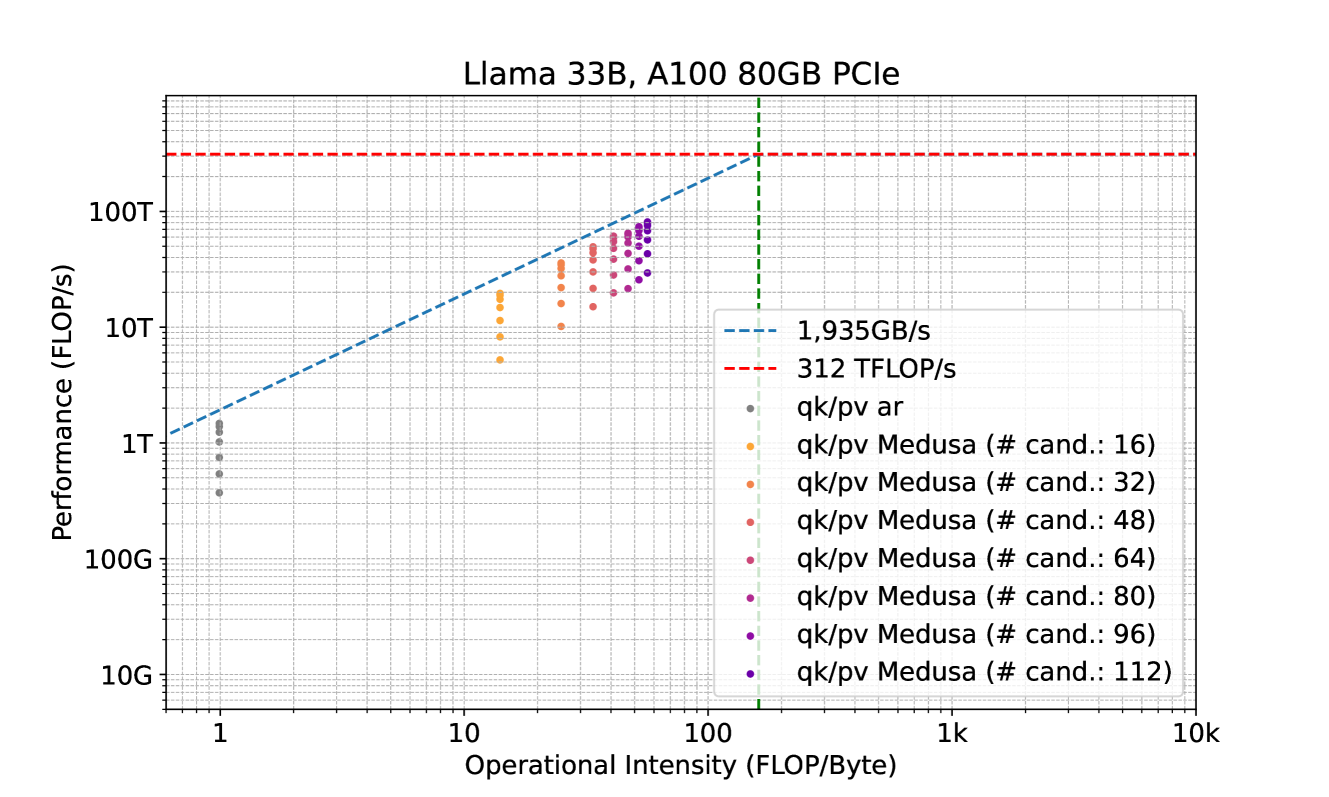
- **Title**: Llama 33B, A100 80GB PCIe
- **Axes**:
- **Y-Axis**: Performance (FLOP/s) [Logarithmic scale: 10G → 100T]
- **X-Axis**: Operational Intensity (FLOP/Byte) [Logarithmic scale: 1 → 10k]
## Key Elements
1. **Performance Thresholds**:
- **Blue Dashed Line**: 1,935GB/s (Memory bandwidth limit)
- **Red Dashed Line**: 312 TFLOP/s (Compute limit)
- **Green Vertical Line**: 100 FLOP/Byte (Operational intensity threshold)
2. **Data Series**:
- **qk/pv ar** (Gray markers): Single data point at ~1 FLOP/Byte, ~1T FLOP/s performance.
- **qk/pv Medusa** (Colored markers):
- **16 candidates**: Orange (100G FLOP/s at ~10 FLOP/Byte)
- **32 candidates**: Orange (1T FLOP/s at ~100 FLOP/Byte)
- **48 candidates**: Red (10T FLOP/s at ~1k FLOP/Byte)
- **64 candidates**: Pink (100T FLOP/s at ~10k FLOP/Byte)
- **80 candidates**: Purple (100T FLOP/s at ~10k FLOP/Byte)
- **96 candidates**: Purple (100T FLOP/s at ~10k FLOP/Byte)
- **112 candidates**: Violet (100T FLOP/s at ~10k FLOP/Byte)
## Trends
- **Performance Scaling**:
- Performance increases linearly with operational intensity until hitting the **312 TFLOP/s** compute limit (red line).
- Memory bandwidth (**1,935GB/s**, blue line) becomes the bottleneck beyond ~100 FLOP/Byte.
- **Medusa Efficiency**:
- Higher candidate counts (16 → 112) show diminishing returns in performance gains.
- All Medusa configurations plateau at **100T FLOP/s** near the compute limit.
## Critical Observations
- The **green vertical line** at 100 FLOP/Byte marks the transition point where compute limits dominate over memory bandwidth constraints.
- **qk/pv ar** (gray) represents a baseline configuration with minimal operational intensity and performance.
- **qk/pv Medusa** configurations demonstrate scalability but are constrained by hardware limits at high operational intensities.