# Technical Document Extraction: Scatter Plot Analysis
## 1. Labels and Axis Titles
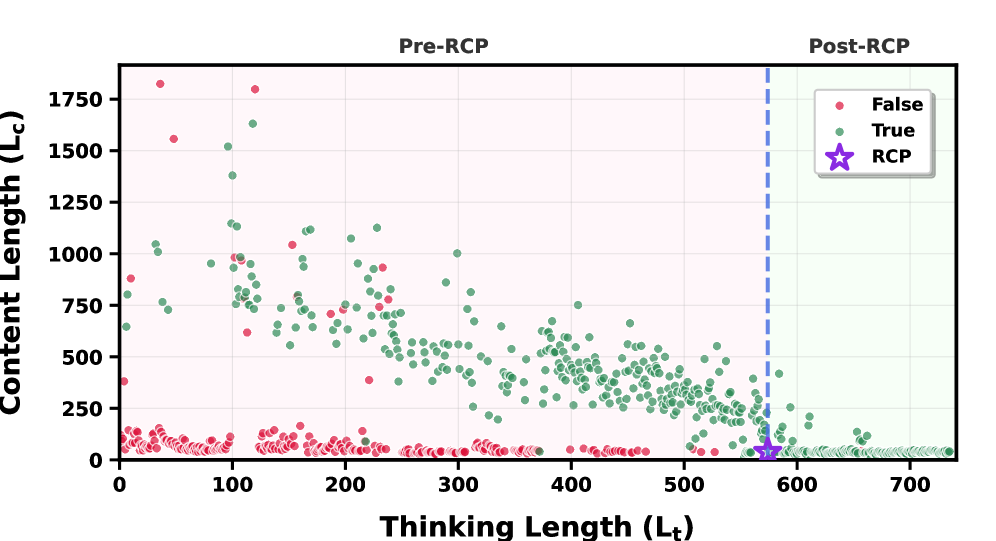
- **X-Axis**: "Thinking Length (Lt)" with numerical markers from 0 to 700 in increments of 100.
- **Y-Axis**: "Content Length (Lc)" with numerical markers from 0 to 1750 in increments of 250.
- **Regions**:
- **Pre-RCP**: Left of the vertical dashed line at x=600 (pink-shaded area).
- **Post-RCP**: Right of the vertical dashed line at x=600 (green-shaded area).
## 2. Legend
- **Location**: Top-right corner of the plot.
- **Entries**:
- **Red Dots**: Labeled "False".
- **Green Dots**: Labeled "True".
- **Purple Star**: Labeled "RCP".
## 3. Data Points and Trends
### **Red Dots (False)**
- **Distribution**:
- Concentrated in the lower-left region (x < 300, y < 250).
- Sparse presence in the Pre-RCP region (x = 300–500, y = 250–750).
- **Trend**:
- Downward slope from (x=0, y=1750) to (x=500, y=0).
- Density decreases as x increases.
### **Green Dots (True)**
- **Distribution**:
- Spread across both Pre-RCP and Post-RCP regions.
- Higher density in Post-RCP (x > 600, y = 0–250).
- **Trend**:
- Scattered distribution with no clear slope.
- Concentration near the Post-RCP boundary (x=600, y=50–250).
### **Purple Star (RCP)**
- **Location**:
- Coordinates: (x=600, y=50).
- Positioned at the intersection of the Post-RCP region and the x=600 boundary.
## 4. Spatial Grounding
- **Legend Position**:
- Coordinates: [x=650, y=150] (relative to the plot's top-right corner).
- **Color Consistency Check**:
- Red dots match "False" in the legend.
- Green dots match "True" in the legend.
- Purple star matches "RCP" in the legend.
## 5. Component Isolation
### **Header**
- Title: "Pre-RCP" (left) and "Post-RCP" (right) with a vertical dashed line at x=600.
### **Main Chart**
- **Data Series**:
- Red dots (False): 100+ points, primarily in Pre-RCP.
- Green dots (True): 200+ points, distributed across both regions.
- Purple star (RCP): 1 point at (600, 50).
### **Footer**
- No additional text or components.
## 6. Key Observations
- The vertical dashed line at x=600 demarcates a clear boundary between Pre-RCP and Post-RCP regions.
- The RCP (purple star) is the only data point in the Post-RCP region with a defined y-value (y=50).
- Red dots (False) dominate the lower-left quadrant, while green dots (True) are more evenly distributed but denser in Post-RCP.
## 7. Missing Information
- No explicit numerical data table or additional textual annotations beyond the legend and axis labels.
- No explicit units for "Thinking Length (Lt)" or "Content Length (Lc)" beyond the axis labels.
## 8. Language Notes
- All text is in English. No non-English content detected.