## Chart: Accuracy vs. Compute for Different Models
### Overview
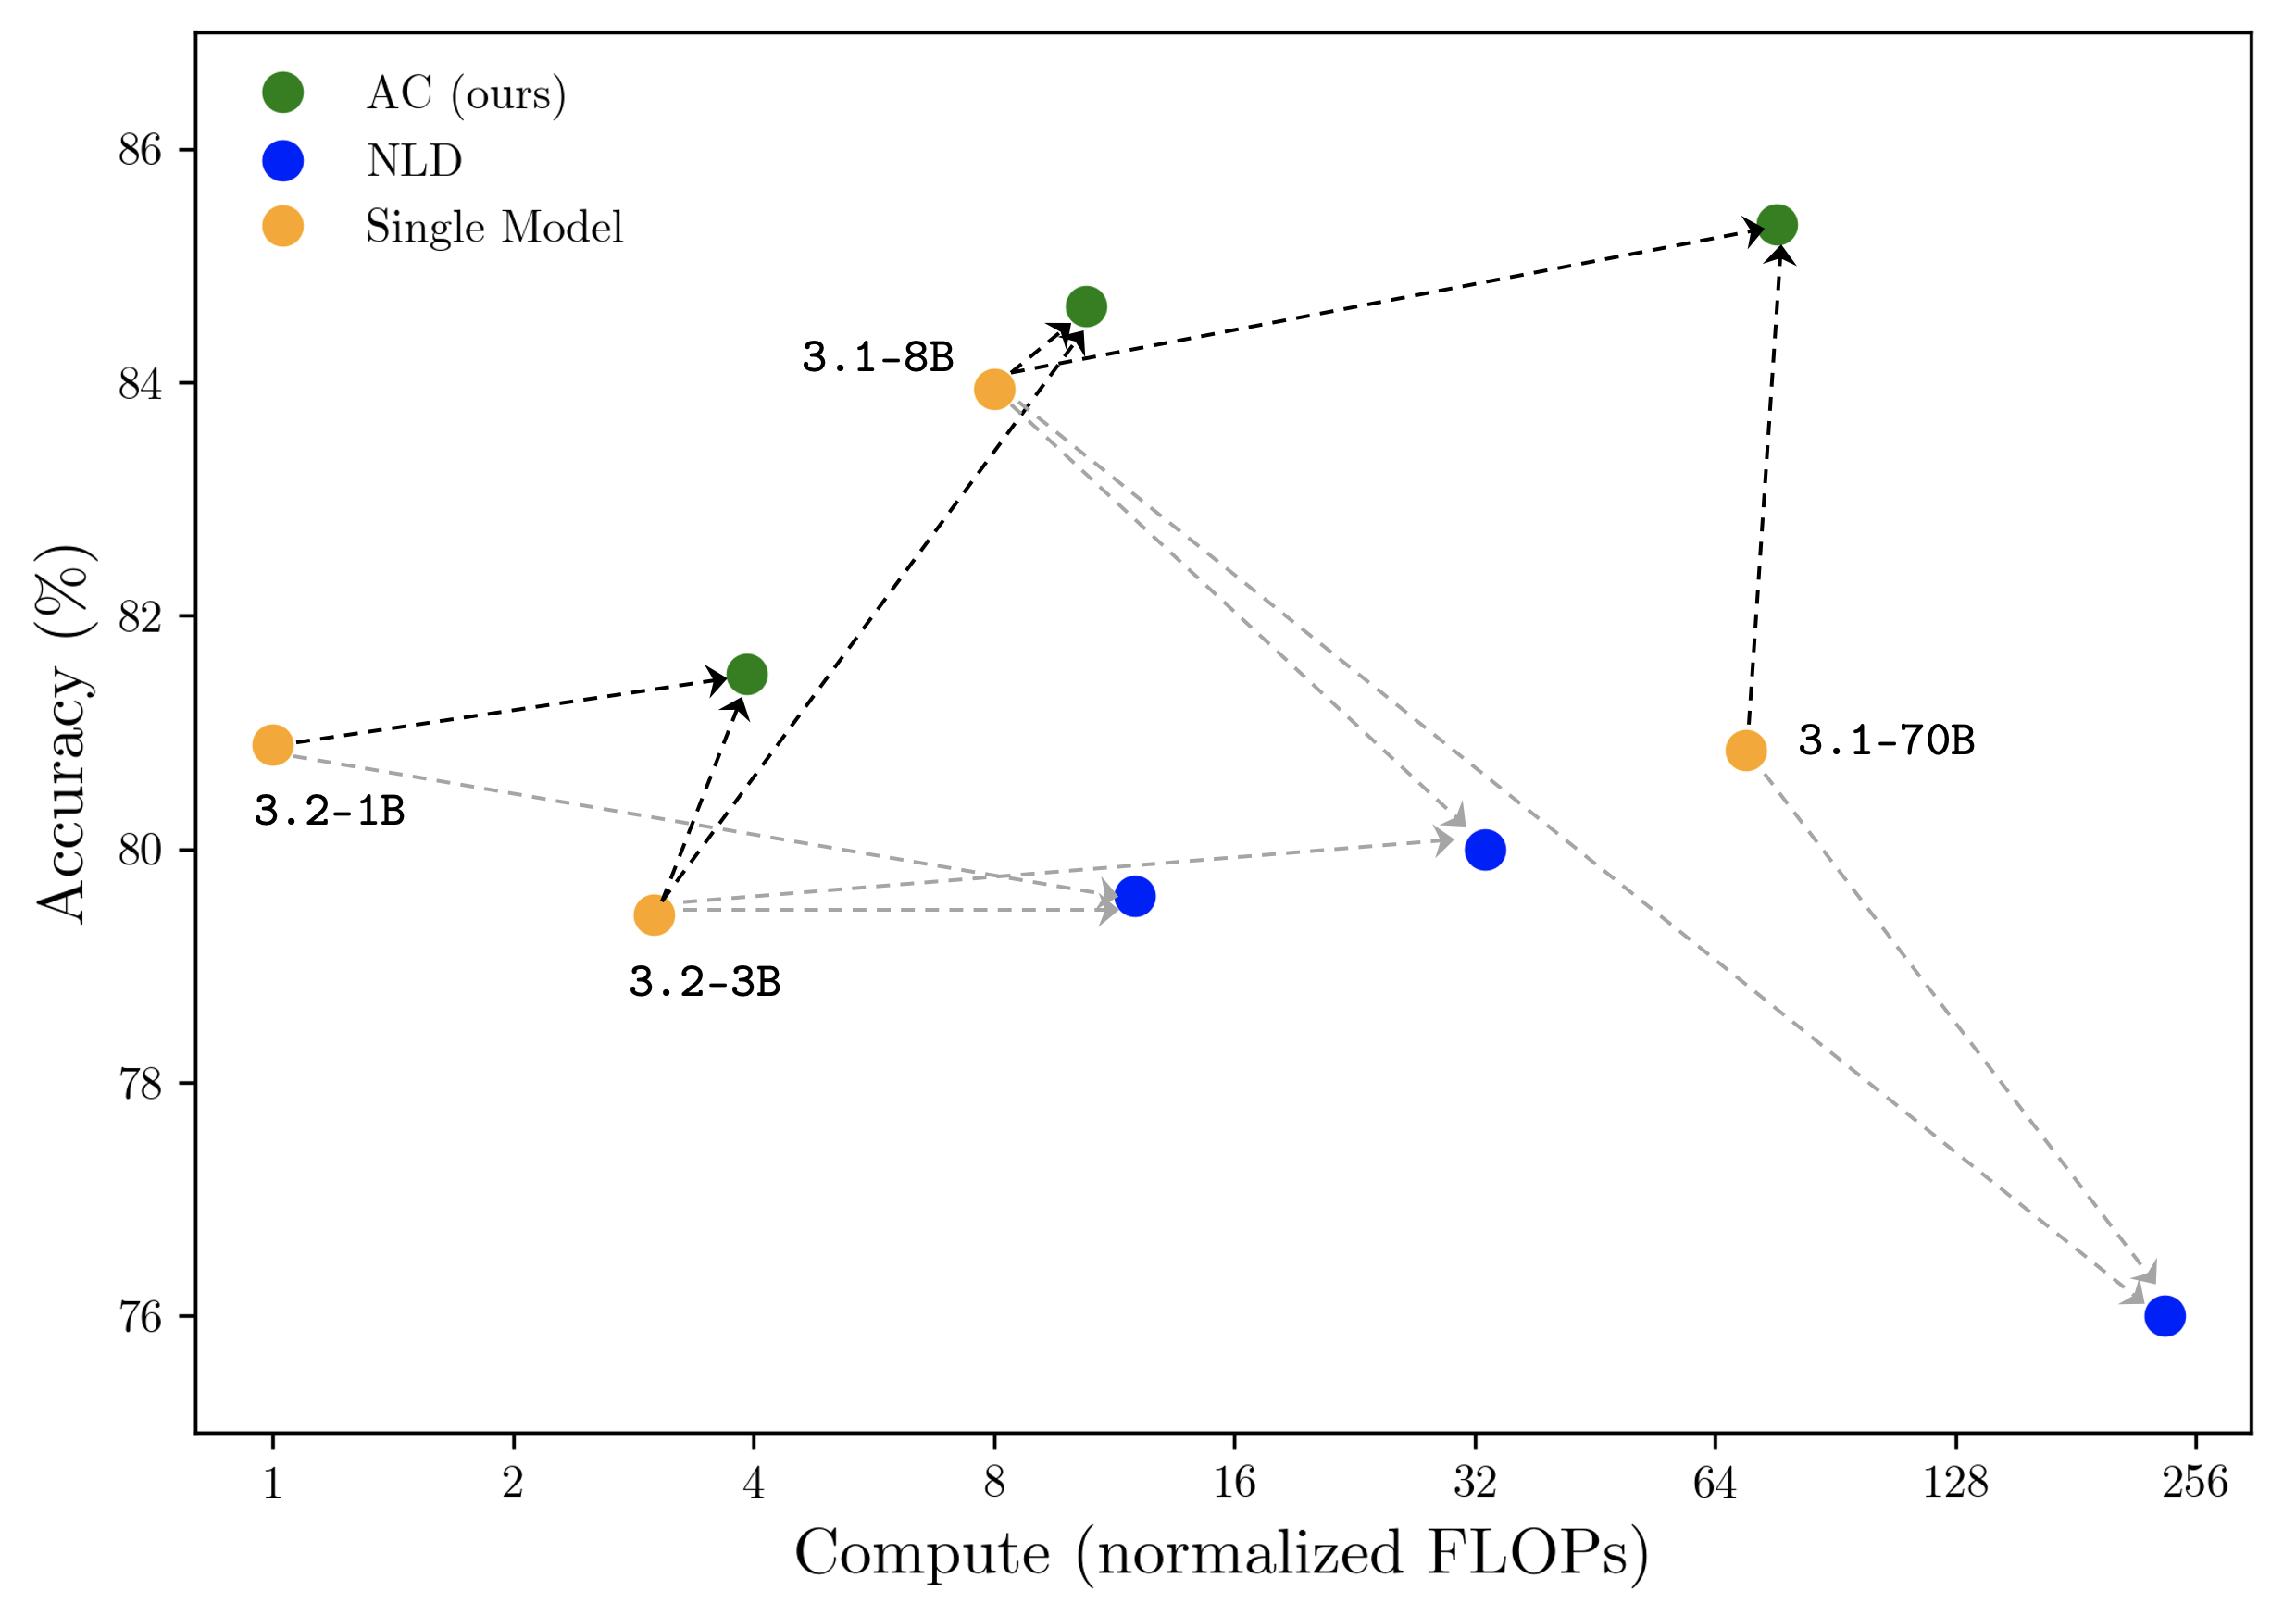
This chart displays the relationship between accuracy (in percentage) and compute (normalized FLOPs) for three different model types: AC (ours), NLD, and Single Model. The chart uses lines to represent the performance of each model as compute increases. Several data points are labeled with model versions (e.g., 3.1-8B, 3.2-1B).
### Components/Axes
* **X-axis:** Compute (normalized FLOPs), ranging from 1 to 256. The scale is logarithmic.
* **Y-axis:** Accuracy (%), ranging from 76% to 86%.
* **Legend:** Located in the top-left corner.
* Green circles: AC (ours)
* Gray dashed line: NLD
* Orange circles: Single Model
* **Data Points:** Several data points are labeled with model names and sizes (e.g., 3.1-8B, 3.2-1B, 3.1-70B, 3.2-3B).
### Detailed Analysis
**AC (ours) - Green Line:**
The green line representing "AC (ours)" generally slopes upward, indicating increasing accuracy with increasing compute.
* At approximately 4 FLOPs, the accuracy is around 82%.
* At approximately 8 FLOPs, the accuracy reaches a peak of around 84.5%.
* At approximately 16 FLOPs, the accuracy remains around 84.5%.
* At approximately 32 FLOPs, the accuracy is around 84.5%.
* At approximately 64 FLOPs, the accuracy is around 85%.
* At approximately 128 FLOPs, the accuracy is around 85%.
* At approximately 256 FLOPs, the accuracy is around 85%.
**NLD - Gray Dashed Line:**
The gray dashed line representing "NLD" shows a more fluctuating trend.
* At approximately 4 FLOPs, the accuracy is around 81%.
* At approximately 8 FLOPs, the accuracy is around 83%.
* At approximately 16 FLOPs, the accuracy is around 83.5%.
* At approximately 32 FLOPs, the accuracy is around 80%.
* At approximately 64 FLOPs, the accuracy is around 79%.
* At approximately 128 FLOPs, the accuracy is around 77%.
* At approximately 256 FLOPs, the accuracy is around 76%.
**Single Model - Orange Line:**
The orange line representing "Single Model" shows a relatively flat trend initially, followed by a decline.
* At approximately 1 FLOP, the accuracy is around 80.5%.
* At approximately 2 FLOPs, the accuracy is around 80.5%.
* At approximately 4 FLOPs, the accuracy is around 81%.
* At approximately 8 FLOPs, the accuracy is around 80%.
* At approximately 16 FLOPs, the accuracy is around 80%.
* At approximately 32 FLOPs, the accuracy is around 79%.
* At approximately 64 FLOPs, the accuracy is around 78%.
* At approximately 128 FLOPs, the accuracy is around 73%.
* At approximately 256 FLOPs, the accuracy is around 71%.
### Key Observations
* The "AC (ours)" model consistently achieves the highest accuracy across all compute levels.
* The "NLD" model shows a decreasing trend in accuracy as compute increases beyond 16 FLOPs.
* The "Single Model" exhibits a significant drop in accuracy at higher compute levels (above 64 FLOPs).
* The "AC (ours)" model demonstrates relatively stable accuracy as compute increases, suggesting diminishing returns.
* The labeled data points (e.g., 3.1-8B, 3.2-1B) provide specific model configurations and their corresponding performance.
### Interpretation
The chart demonstrates the trade-off between compute and accuracy for different model architectures. The "AC (ours)" model appears to be the most efficient, achieving high accuracy with a relatively moderate amount of compute. The "NLD" model initially performs well but degrades in accuracy as compute increases, potentially indicating overfitting or limitations in its architecture. The "Single Model" suffers a substantial accuracy loss at higher compute levels, suggesting it may not scale effectively. The labeled data points allow for a more granular understanding of how specific model configurations impact performance. The diminishing returns observed in the "AC (ours)" model suggest that further increases in compute may not yield significant improvements in accuracy. This data is valuable for model selection and resource allocation, guiding developers towards the most efficient and effective architectures for their specific needs. The chart suggests that the "AC (ours)" model is a strong candidate for applications where both accuracy and computational efficiency are critical.