## Scatter Plot: Model Accuracy vs. Compute Efficiency
### Overview
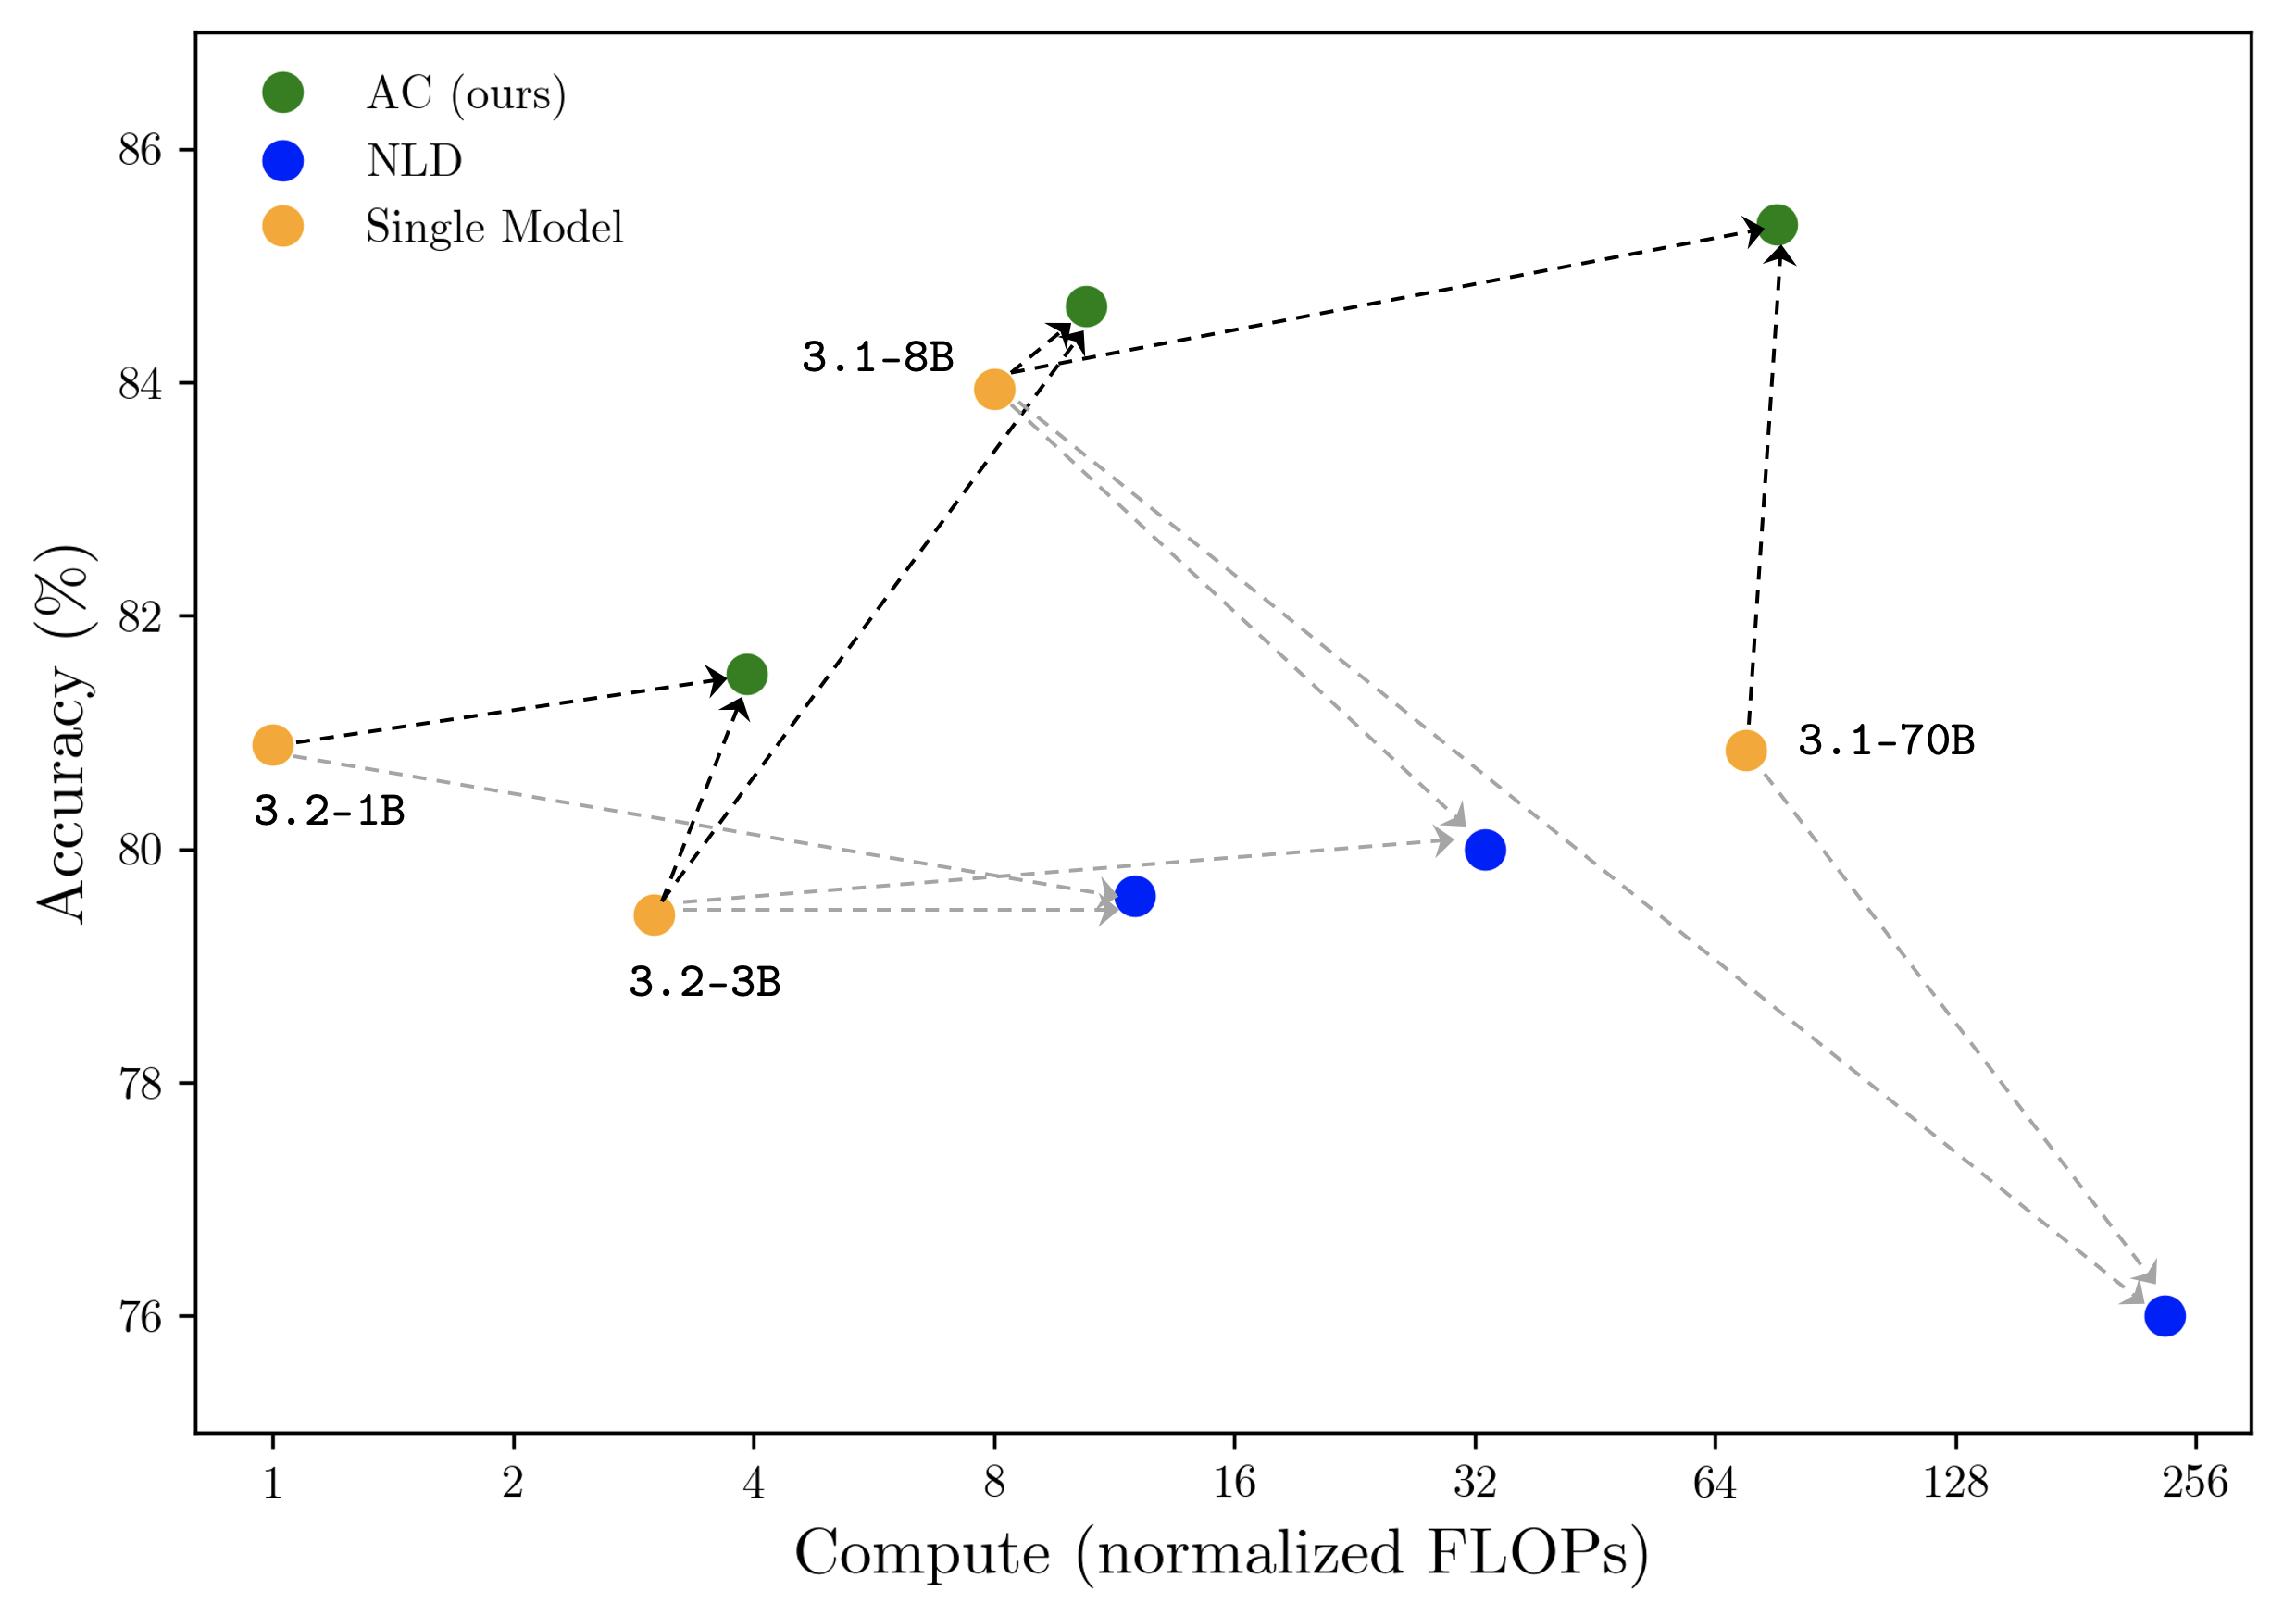
The image is a scatter plot comparing the accuracy (in %) of three model configurations (AC, NLD, Single Model) against their computational cost (normalized FLOPs). The plot uses dashed lines to connect data points for each model, illustrating trends in performance relative to compute resources.
### Components/Axes
- **X-axis (Compute)**: Normalized FLOPs, ranging from 1 to 256 (logarithmic scale).
- **Y-axis (Accuracy)**: Percentage accuracy, ranging from 76% to 86%.
- **Legend**:
- Green: AC (ours)
- Blue: NLD
- Orange: Single Model
- **Data Points**: Labeled with model configurations (e.g., "3.2-1B", "3.1-8B") and connected by dashed lines.
### Detailed Analysis
#### AC (Ours) [Green]
- **3.2-1B**: 4 FLOPs, 81.5% accuracy.
- **3.1-8B**: 8 FLOPs, 84.2% accuracy.
- **3.1-70B**: 64 FLOPs, 85.3% accuracy.
- **Trend**: Steady upward trajectory as compute increases.
#### NLD [Blue]
- **3.2-3B**: 8 FLOPs, 79.5% accuracy.
- **3.1-70B**: 64 FLOPs, 76.8% accuracy.
- **3.2-1B**: 4 FLOPs, 80.1% accuracy.
- **Trend**: Slight decline in accuracy with increased compute (e.g., 80.1% → 79.5% → 76.8%).
#### Single Model [Orange]
- **3.2-1B**: 4 FLOPs, 80.5% accuracy.
- **3.2-3B**: 8 FLOPs, 79.2% accuracy.
- **3.1-70B**: 64 FLOPs, 80.8% accuracy.
- **Trend**: Minimal fluctuation, maintaining ~80% accuracy across compute levels.
### Key Observations
1. **AC (Ours)** achieves the highest accuracy (85.3%) at 64 FLOPs, outperforming other models at higher compute levels.
2. **NLD** shows a notable drop in accuracy (from 80.1% to 76.8%) as compute increases, suggesting inefficiency or overfitting.
3. **Single Model** maintains stable accuracy (~80%) but lags behind AC in performance.
4. **Compute vs. Accuracy**: AC demonstrates the best trade-off, achieving higher accuracy with relatively low compute (e.g., 84.2% at 8 FLOPs).
### Interpretation
The data highlights the superiority of the AC model (ours) in balancing accuracy and computational efficiency. NLD's declining performance with increased compute suggests potential architectural limitations or suboptimal scaling. The Single Model serves as a baseline, but AC consistently outperforms it. The plot underscores the importance of model design in optimizing resource utilization, with AC achieving state-of-the-art results without excessive computational overhead.