\n
## Diagram: Computational Model and Brain Activation Data Flow
### Overview
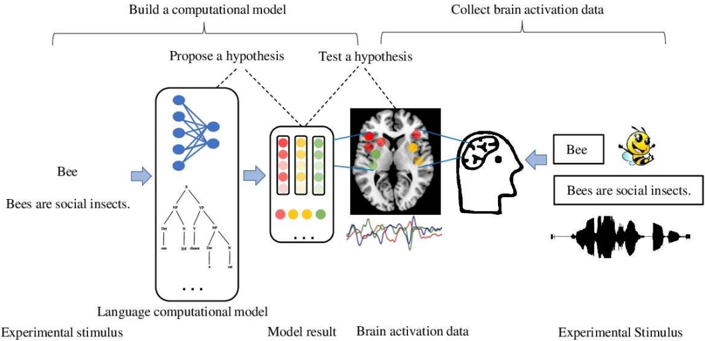
The image depicts a diagram illustrating the workflow between building a computational model and collecting brain activation data, specifically in the context of studying bee-related stimuli. The diagram shows a cyclical process of proposing and testing hypotheses, linking a language computational model to brain activation data.
### Components/Axes
The diagram is divided into four main sections, labeled from left to right:
1. **Experimental stimulus:** "Bee" and the sentence "Bees are social insects."
2. **Language computational model:** A rectangular block containing a neural network diagram.
3. **Model result:** A rectangular block with colored circles representing model outputs.
4. **Brain activation data:** A grayscale brain scan with highlighted areas and associated waveforms, alongside an image of a bee and the sentence "Bees are social insects."
There are also two overarching headers: "Build a computational model" (covering the first two sections) and "Collect brain activation data" (covering the last two sections). Arrows indicate the flow of information between these sections. Two labels "Propose a hypothesis" and "Test a hypothesis" are placed above the arrows connecting the computational model to the brain activation data.
### Detailed Analysis or Content Details
* **Experimental Stimulus:** The stimulus consists of the word "Bee" and the sentence "Bees are social insects." An image of a bee is also present. A waveform is shown below the bee image.
* **Language Computational Model:** This section shows a neural network. The network has input nodes (blue circles) and interconnected layers. The network appears to have multiple layers, indicated by the "..." at the bottom.
* **Model Result:** This section displays a series of colored circles arranged in a rectangular block. The colors are (from top to bottom): red, orange, yellow, green. There are multiple circles of each color.
* **Brain Activation Data:** A grayscale brain scan is shown in profile. Several areas within the brain are highlighted with colored overlays that correspond to the colors in the "Model Result" section. The colors are: red, orange, yellow, and green. Below the brain scan are waveforms, likely representing brain activity. The waveforms vary in amplitude and frequency.
* **Arrows:** Arrows connect the "Experimental Stimulus" to the "Language Computational Model," the "Language Computational Model" to the "Model Result," and the "Model Result" to the "Brain Activation Data." There is also an arrow looping back from the "Brain Activation Data" to the "Experimental Stimulus," suggesting a cyclical process.
### Key Observations
The diagram highlights a connection between a computational model of language processing and actual brain activity. The colored circles in the "Model Result" section appear to map directly onto the highlighted areas in the "Brain Activation Data" section, suggesting that the model's outputs correlate with specific brain regions. The cyclical nature of the process indicates an iterative approach to hypothesis testing.
### Interpretation
This diagram illustrates a methodology for understanding the neural basis of language processing, potentially in relation to concepts associated with bees and social insects. The computational model serves as a simplified representation of the brain, and the comparison between the model's outputs and brain activation data allows researchers to test hypotheses about how the brain processes information. The correspondence between the colors in the "Model Result" and "Brain Activation Data" suggests that the model is capturing some aspects of the brain's response to the stimulus. The iterative loop implies that the model can be refined based on the brain activation data, leading to a more accurate understanding of the underlying neural mechanisms. The diagram suggests a reductionist approach, attempting to explain complex brain activity through a simplified computational model. The use of a bee as the stimulus suggests a specific focus on how the brain processes information related to this insect and its social behavior.