\n
## Diagram: Computational Neuroscience Research Workflow
### Overview
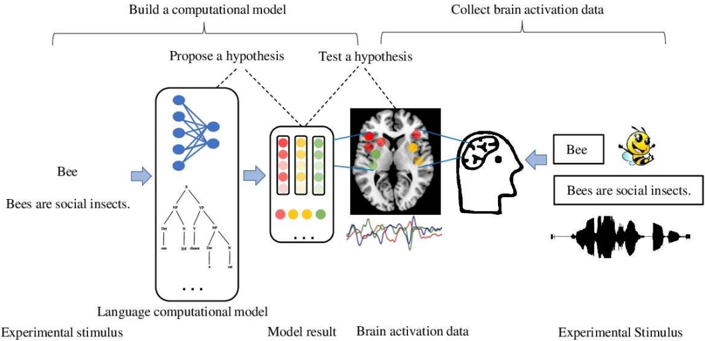
This image is a technical diagram illustrating a two-phase research methodology in computational neuroscience or neurolinguistics. It depicts the process of building a computational language model and then validating it by comparing its predictions to actual human brain activation data collected in response to the same linguistic stimuli. The flow is primarily left-to-right, with a feedback loop implied by the "Test a hypothesis" step.
### Components/Axes
The diagram is segmented into distinct regions with clear labels:
**Top-Level Phases (Labeled at the top):**
1. **Left Phase:** "Build a computational model"
2. **Right Phase:** "Collect brain activation data"
**Process Steps (Labeled within the phases):**
* Under "Build a computational model":
* "Propose a hypothesis"
* "Test a hypothesis" (connected by a dashed line to the brain data section)
**Core Components (Labeled at the bottom, from left to right):**
1. **Experimental stimulus (Left):** The input to the computational model.
2. **Language computational model:** The model being built and tested.
3. **Model result:** The output or prediction from the model.
4. **Brain activation data:** The measured neural response from a human subject.
5. **Experimental Stimulus (Right):** The input presented to the human subject.
**Visual Elements & Embedded Text:**
* **Left Experimental Stimulus:** Contains the text "Bee" and the sentence "Bees are social insects."
* **Language computational model:** Represented by two icons: a neural network diagram (blue nodes and connections) and a hierarchical tree structure (black lines and nodes).
* **Model result:** Depicted as a vertical bar with three columns of colored dots (red, yellow, green). Below it are three larger, solid-colored circles (red, yellow, green).
* **Brain activation data:** Shows an axial slice of a human brain scan. Overlaid on the brain are colored regions (red, yellow, green) that correspond to the colors in the "Model result." Below the brain scan is a waveform graph with three lines (red, yellow, green).
* **Human Subject Icon:** A silhouette of a head with a brain icon inside.
* **Right Experimental Stimulus:** Contains the text "Bee" and the sentence "Bees are social insects." Next to it is a cartoon bee icon.
* **Audio Waveform:** A black waveform graphic is shown below the right-side stimulus text.
### Detailed Analysis
The diagram outlines a specific experimental loop:
1. **Stimulus Input:** The process begins with a linguistic stimulus ("Bee" / "Bees are social insects.").
2. **Model Processing:** This stimulus is fed into a "Language computational model," which is proposed as a hypothesis for how the brain processes language. The model's architecture is suggested to involve both neural network and syntactic tree components.
3. **Model Prediction:** The model generates a "Model result," visualized as a pattern of activation across three categories (represented by red, yellow, and green dots).
4. **Human Experiment:** The *same* stimulus is presented to a human participant.
5. **Data Collection:** The participant's brain response is measured, yielding "Brain activation data." This data is presented in two forms: a spatial map (the brain scan showing *where* activation occurs) and a temporal signal (the waveform graph showing *when* activation occurs).
6. **Hypothesis Testing:** The core of the methodology is the comparison between the "Model result" and the "Brain activation data." The colored dots from the model are visually linked to the colored regions in the brain scan, indicating a direct comparison of the model's predicted activation patterns with the observed neural patterns. This step is labeled "Test a hypothesis."
### Key Observations
* **Color-Coded Correspondence:** The most critical visual cue is the consistent use of red, yellow, and green across the "Model result" (dots), the "Brain activation data" (brain regions and waveform lines). This establishes a direct, one-to-one mapping between the model's predicted categories and the observed neural data.
* **Dual Data Representation:** Brain activation is shown both spatially (the brain scan) and temporally (the waveform), suggesting the model may be tested against both spatial localization and time-course data.
* **Symmetry of Stimuli:** The experimental stimulus is identical on both the model input side and the human subject side, which is fundamental for a valid comparison.
* **Workflow Integration:** The dashed line from "Test a hypothesis" back to the model section implies an iterative process where test results may refine the computational model.
### Interpretation
This diagram represents a **model-based cognitive neuroscience approach**. It demonstrates a method for validating a theoretical computational model of language processing by using it to generate predictions that are then tested against empirical neuroimaging data.
* **What it suggests:** The research aims to determine if the internal representations or processing steps of the artificial "Language computational model" correspond to the biological processes in the human brain when understanding the same linguistic input. A successful match (indicated by the color correspondence) would support the model as a plausible theory of neural language processing.
* **How elements relate:** The entire diagram is a closed loop of scientific inquiry: Hypothesis (the model) -> Prediction (model result) -> Experiment (collecting brain data) -> Test (comparison). The human brain is the ground truth against which the computational hypothesis is measured.
* **Notable aspects:** The inclusion of both a neural network and a tree structure in the model icon suggests the hypothesis may involve combining distributed, connectionist processing with symbolic, hierarchical syntactic structure. The waveform data indicates that the temporal dynamics of brain activity are considered an important constraint for the model, not just the location of activation.