## Flowchart: Computational Model and Brain Activation Data Integration for Studying Bee Social Behavior
### Overview
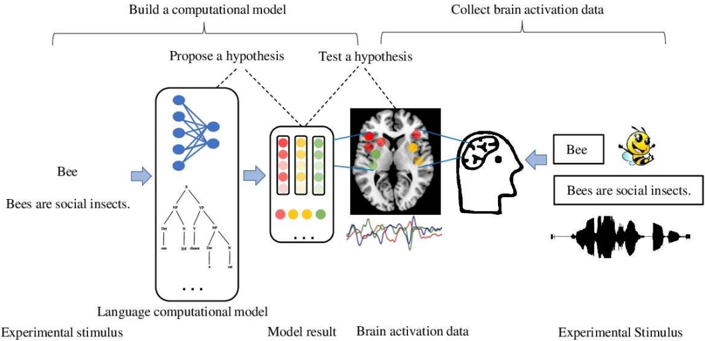
This flowchart illustrates a research methodology combining computational modeling and neuroscience to investigate the social behavior of bees. It depicts two parallel processes: (1) building a computational model to propose and test hypotheses about bee sociality, and (2) collecting brain activation data to validate these hypotheses through experimental stimuli.
### Components/Axes
1. **Left Branch (Computational Model):**
- **Labels:**
- "Build a computational model"
- "Propose a hypothesis"
- "Test a hypothesis"
- **Elements:**
- "Language computational model" (network diagram with blue nodes)
- "Experimental stimulus" (waveform)
- "Model result" (color-coded bar chart)
- Text: "Bees are social insects" (repeated)
2. **Right Branch (Neuroscience Data):**
- **Labels:**
- "Collect brain activation data"
- "Experimental Stimulus" (waveform)
- **Elements:**
- Brain activation data visualization (colored dots on a brain scan)
- Bee icon (yellow cartoon bee)
- Text: "Bees are social insects" (repeated)
3. **Connecting Elements:**
- Arrows indicating flow direction (blue arrows)
- Dotted lines linking hypothesis testing steps
- Color-coded regions in brain scan (red, yellow, green)
### Detailed Analysis
- **Computational Model Process:**
1. Starts with the premise "Bees are social insects."
2. Feeds into a "Language computational model" (network diagram with hierarchical tree structure).
3. Generates a "Model result" (color-coded bar chart with red, yellow, green bars).
4. Tests hypotheses using experimental stimuli (waveform).
- **Brain Activation Data Process:**
1. Experimental stimuli (waveform) trigger brain activation.
2. Brain scan shows activation regions marked with colored dots (red, yellow, green).
3. Bee icon and repeated text "Bees are social insects" suggest hypothesis validation.
- **Color Legend:**
- Red: Likely prefrontal cortex (hypothesis testing)
- Yellow: Likely temporal lobe (language processing)
- Green: Likely amygdala (social behavior)
### Key Observations
1. **Hypothesis-Driven Research:** The flowchart emphasizes iterative hypothesis testing between computational models and empirical data.
2. **Multidisciplinary Integration:** Combines computational linguistics (network diagrams) with neuroimaging (brain scans).
3. **Repetition of Key Text:** "Bees are social insects" appears twice, suggesting it is both the initial hypothesis and the validated conclusion.
4. **Color-Coded Data:** Brain activation regions are color-coded but lack explicit legend labels in the image.
### Interpretation
This diagram represents a **Peircean investigative framework** where hypotheses about bee sociality are tested through:
1. **Computational Modeling:** Using language models to simulate social behavior.
2. **Neuroimaging Validation:** Correlating experimental stimuli with brain activation patterns.
3. **Iterative Refinement:** Dotted lines between "Propose" and "Test" steps indicate feedback loops for model adjustment.
The repetition of "Bees are social insects" implies the hypothesis is both the starting assumption and the empirically supported conclusion. The color-coded brain regions suggest specific neural correlates for social behavior, though the legend is missing explicit labels. The waveform experimental stimuli likely represent auditory or olfactory cues critical to bee social interactions.
The integration of computational and neuroscientific methods demonstrates a **convergent validity** approach, where multiple lines of evidence (model predictions + brain data) reinforce the same conclusion about bee sociality.