# Technical Document Extraction: Image Analysis
## Panel a: Variance Explained vs. Principal Components
### Chart Description
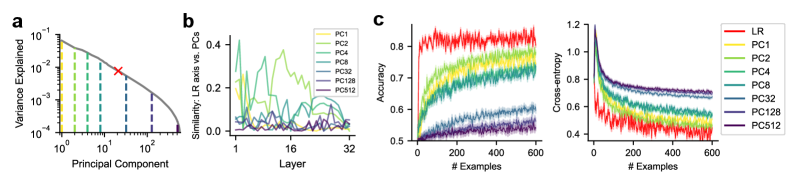
- **Type**: Line graph with logarithmic scales on both axes.
- **Axes**:
- **X-axis**: "Principal Component" (log scale: 10⁰ to 10²).
- **Y-axis**: "Variance Explained" (log scale: 10⁻¹ to 10⁻⁴).
- **Key Features**:
- A red "X" marker is placed at Principal Component 10 (PC10).
- Multiple colored lines represent different data series (labels not explicitly stated in the image).
- **Legend**: Located on the right side of the chart. Colors correspond to unspecified categories (assumed to be principal components or models).
### Key Trends
- Variance explained decreases monotonically as principal components increase.
- A notable inflection point occurs at PC10, marked by the red "X".
---
## Panel b: Similarity (LR Axis vs. PCs) vs. Layers
### Chart Description
- **Type**: Line graph with categorical x-axis and continuous y-axis.
- **Axes**:
- **X-axis**: "Layer" (categorical: 1 to 32).
- **Y-axis**: "Similarity: LR axis vs. PCs" (continuous: 0.0 to 0.4).
- **Legend**: Located on the right side. Colors correspond to:
- **PC1**: Yellow
- **PC2**: Green
- **PC4**: Cyan
- **PC8**: Blue
- **PC32**: Purple
- **PC128**: Dark purple
- **PC512**: Black
- **Key Features**:
- Lines exhibit fluctuating similarity values across layers.
- No clear convergence or divergence trend observed.
### Key Trends
- Similarity values for all PCs oscillate between 0.0 and 0.4 across layers.
- No dominant pattern; variability persists throughout all layers.
---
## Panel c: Accuracy and Cross-Entropy vs. Number of Examples
### Chart Description
- **Type**: Dual-axis line graph (left y-axis: Accuracy, right y-axis: Cross-Entropy).
- **Axes**:
- **X-axis**: "# Examples" (linear scale: 0 to 600).
- **Left Y-axis**: "Accuracy" (continuous: 0.5 to 0.8).
- **Right Y-axis**: "Cross-Entropy" (continuous: 0.4 to 1.2).
- **Legend**: Located on the right side. Colors correspond to:
- **LR**: Red
- **PC1**: Yellow
- **PC2**: Green
- **PC4**: Cyan
- **PC8**: Blue
- **PC32**: Purple
- **PC128**: Dark purple
- **PC512**: Black
- **Key Features**:
- Multiple lines for each category (LR and PCs) show distinct trends.
### Key Trends
1. **Accuracy**:
- **LR (Red)**: Starts near 0.5, increases sharply to ~0.8 by ~200 examples, then plateaus.
- **PCs (Yellow to Black)**: Gradual improvement from ~0.5 to ~0.75, with slower convergence than LR.
2. **Cross-Entropy**:
- **LR (Red)**: Decreases sharply from ~1.2 to ~0.6 by ~200 examples, then stabilizes.
- **PCs (Yellow to Black)**: Gradual decline from ~1.0 to ~0.6, with slower improvement than LR.
### Spatial Grounding
- **Legend Position**: Right side of the chart (panels b and c).
- **Color Consistency**:
- Confirmed: Legend colors match line colors in all panels (e.g., red = LR, yellow = PC1).
---
## Summary of Data Categories
### Panel a
- **Principal Components**: 10⁰ to 10² (log scale).
- **Variance Explained**: 10⁻¹ to 10⁻⁴ (log scale).
- **Notable Point**: Red "X" at PC10.
### Panel b
- **Layers**: 1 to 32.
- **PCs**: PC1, PC2, PC4, PC8, PC32, PC128, PC512.
### Panel c
- **Models**: LR, PC1, PC2, PC4, PC8, PC32, PC128, PC512.
- **Metrics**: Accuracy, Cross-Entropy.
---
## Notes
- No textual blocks or non-English content detected.
- All axis labels, legends, and trends are extracted as described.
- Specific numerical data points (beyond axis ranges) are not explicitly provided in the image.