## Line Chart: Pursuit and Evasion Trajectories
### Overview
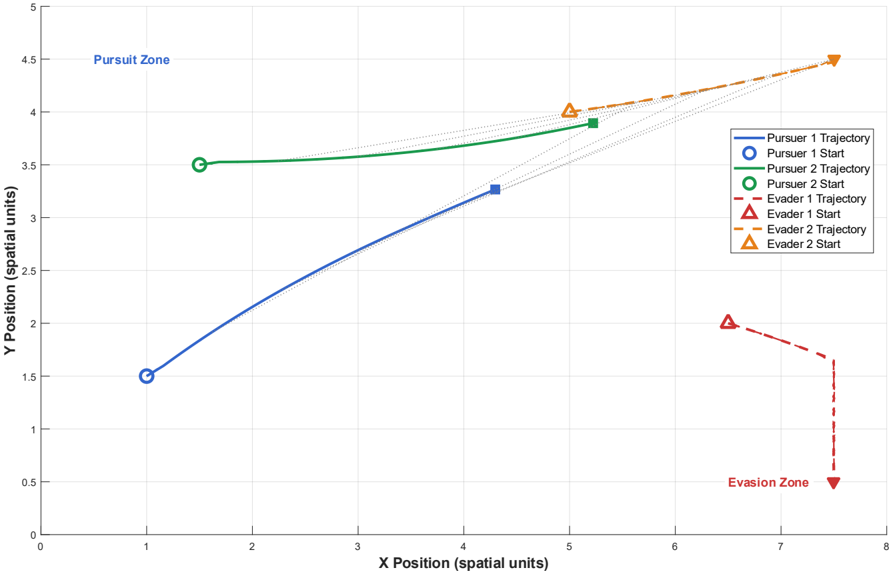
The chart depicts trajectories of two pursuers and two evaders in a 2D spatial environment. It includes labeled zones ("Pursuit Zone" and "Evasion Zone") and uses color-coded lines with markers to represent movement paths. The X-axis represents horizontal position (0–8 units), and the Y-axis represents vertical position (0–5 units).
### Components/Axes
- **X-axis**: "X Position (spatial units)" ranging from 0 to 8.
- **Y-axis**: "Y Position (spatial units)" ranging from 0 to 5.
- **Legend**: Located in the top-right corner, mapping colors to entities:
- Blue: Pursuer 1 Trajectory (solid line) and Start (circle marker).
- Green: Pursuer 2 Trajectory (solid line) and Start (circle marker).
- Red: Evader 1 Trajectory (dashed line) and Start (triangle marker).
- Orange: Evader 2 Trajectory (dashed line) and Start (triangle marker).
- **Annotations**:
- "Pursuit Zone" (blue text) in the top-left quadrant.
- "Evasion Zone" (red text) in the bottom-right quadrant, with a downward-pointing arrow.
### Detailed Analysis
1. **Pursuer 1 Trajectory** (blue solid line):
- Starts at (1, 1.5) with a circle marker.
- Ends at (4, 3.2) with a square marker.
- Trend: Steady upward curve with moderate slope.
2. **Pursuer 2 Trajectory** (green solid line):
- Starts at (1.5, 3.5) with a circle marker.
- Ends at (5, 3.9) with a square marker.
- Trend: Gentle upward curve, less steep than Pursuer 1.
3. **Evader 1 Trajectory** (red dashed line):
- Starts at (7, 2) with a triangle marker.
- Ends at (7.5, 0.5) with a triangle marker.
- Trend: Sharp downward slope, nearly vertical descent.
4. **Evader 2 Trajectory** (orange dashed line):
- Starts at (5, 4) with a triangle marker.
- Ends at (7.5, 4.5) with a triangle marker.
- Trend: Gradual upward slope, shallow compared to Evader 1.
### Key Observations
- **Pursuit Dynamics**: Both pursuers move upward and rightward, with Pursuer 1 gaining more vertical distance than Pursuer 2.
- **Evasion Patterns**: Evader 1 descends rapidly, while Evader 2 ascends slowly. Their paths diverge spatially.
- **Zone Proximity**:
- Pursuer 1’s trajectory approaches the "Pursuit Zone" (top-left) but does not enter it.
- Evader 1’s trajectory exits the "Evasion Zone" (bottom-right) entirely.
- **Marker Consistency**: All start points match legend symbols (circles for pursuers, triangles for evaders).
### Interpretation
The chart models a pursuit-evasion scenario where:
- Pursuers aim to intercept evaders by converging toward higher Y-values (vertical pursuit).
- Evaders employ contrasting strategies: Evader 1 retreats downward (possibly escaping), while Evader 2 moves upward (potentially toward pursuers).
- The "Pursuit Zone" and "Evasion Zone" likely represent regions of strategic importance, though their exact boundaries are undefined. The trajectories suggest potential interception points near (4, 3.2) for Pursuer 1 and (5, 3.9) for Pursuer 2, though no direct overlap with evader paths is observed.