## Trajectory Chart: Pursuit and Evasion
### Overview
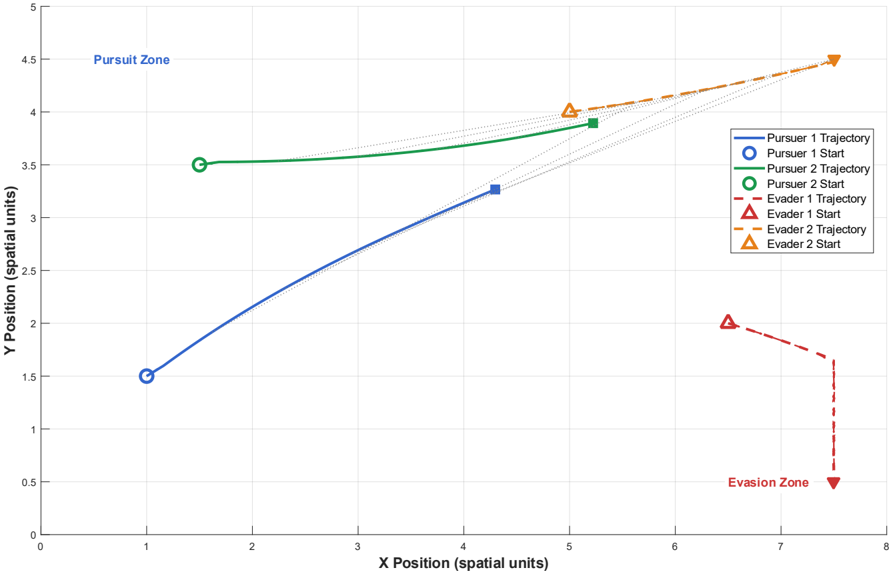
The image is a 2D trajectory chart illustrating the movement of two pursuers and two evaders in a spatial environment. The chart displays the paths of each entity, marked with starting points and trajectories. The X and Y axes represent spatial units. The chart also indicates a "Pursuit Zone" in the top-left and an "Evasion Zone" in the bottom-right.
### Components/Axes
* **X Axis:** "X Position (spatial units)" ranging from 0 to 8.
* **Y Axis:** "Y Position (spatial units)" ranging from 0 to 5.
* **Legend (Right Side):**
* Blue Line: "Pursuer 1 Trajectory"
* Blue Circle: "Pursuer 1 Start"
* Green Line: "Pursuer 2 Trajectory"
* Green Circle: "Pursuer 2 Start"
* Red Dashed Line: "Evader 1 Trajectory"
* Red Triangle: "Evader 1 Start"
* Orange Dashed Line: "Evader 2 Trajectory"
* Orange Triangle: "Evader 2 Start"
* **Zones:**
* "Pursuit Zone" (Top-Left, Blue Text)
* "Evasion Zone" (Bottom-Right, Red Text)
### Detailed Analysis
* **Pursuer 1 (Blue):**
* **Trajectory:** Starts at approximately (1, 1.5) and curves upwards to approximately (5, 3.3).
* **Trend:** The trajectory shows an increasing Y position as the X position increases.
* **Pursuer 2 (Green):**
* **Trajectory:** Starts at approximately (1.5, 3.5) and curves slightly upwards to approximately (5, 3.9).
* **Trend:** The trajectory remains relatively flat with a slight increase in Y position.
* **Evader 1 (Red Dashed):**
* **Trajectory:** Starts at approximately (6.2, 2.0) and moves downwards and to the right, ending at approximately (7.8, 0.5).
* **Trend:** The trajectory shows a decreasing Y position as the X position increases.
* **Evader 2 (Orange Dashed):**
* **Trajectory:** Starts at approximately (5, 4) and moves upwards and to the right, ending at approximately (7.8, 4.5).
* **Trend:** The trajectory shows a slight increase in Y position as the X position increases.
### Key Observations
* The pursuers start in the lower-left region of the chart, while the evaders start in the upper-right.
* The trajectories of the pursuers generally move upwards, indicating an attempt to intercept the evaders.
* Evader 1 moves towards the "Evasion Zone," while Evader 2 moves away from it.
* The starting and ending points of each trajectory are connected by dotted lines to visually link them.
### Interpretation
The chart visualizes a pursuit-evasion scenario. The pursuers (1 and 2) attempt to intercept the evaders (1 and 2). The trajectories indicate the paths taken by each entity. Evader 1 seems to be heading towards the designated "Evasion Zone," while Evader 2 is moving in a different direction. The relative positions and movements suggest a dynamic interaction between the pursuers and evaders, potentially representing a game or simulation. The "Pursuit Zone" and "Evasion Zone" likely define areas of strategic importance for the pursuers and evaders, respectively.