## Chart: Average Correct Flips vs. Iteration
### Overview
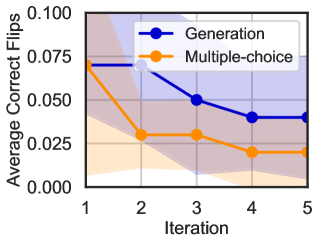
The image is a line chart comparing the average correct flips for two methods, "Generation" and "Multiple-choice," across five iterations. The chart includes shaded regions around each line, likely representing the standard deviation or confidence interval.
### Components/Axes
* **Y-axis:** "Average Correct Flips," ranging from 0.000 to 0.100, with tick marks at 0.025 intervals.
* **X-axis:** "Iteration," ranging from 1 to 5, with tick marks at each integer value.
* **Legend:** Located in the top-right corner, it identifies the two data series:
* Blue: "Generation"
* Orange: "Multiple-choice"
### Detailed Analysis
* **Generation (Blue):**
* Trend: The line starts high, drops significantly between iterations 1 and 3, and then plateaus.
* Data Points:
* Iteration 1: Approximately 0.070
* Iteration 2: Approximately 0.070
* Iteration 3: Approximately 0.050
* Iteration 4: Approximately 0.040
* Iteration 5: Approximately 0.040
* **Multiple-choice (Orange):**
* Trend: The line starts high, drops significantly between iterations 1 and 2, and then decreases gradually.
* Data Points:
* Iteration 1: Approximately 0.070
* Iteration 2: Approximately 0.030
* Iteration 3: Approximately 0.030
* Iteration 4: Approximately 0.020
* Iteration 5: Approximately 0.020
### Key Observations
* Both methods start with similar average correct flips at iteration 1.
* The "Multiple-choice" method experiences a more significant initial drop in performance compared to "Generation."
* The "Generation" method plateaus after iteration 3, while "Multiple-choice" continues to decline slightly.
* The shaded regions indicate variability in the data, with "Generation" showing wider variability, especially in the earlier iterations.
### Interpretation
The chart suggests that both "Generation" and "Multiple-choice" methods have decreasing performance as the iteration number increases. The "Multiple-choice" method initially declines more rapidly, but the "Generation" method shows more variability. The plateauing of "Generation" after iteration 3 might indicate a point of diminishing returns or a stable performance level. The shaded regions provide insight into the consistency of the results, with wider regions suggesting less consistent performance.