\n
## Line Chart: Average Correct Flips vs. Iteration
### Overview
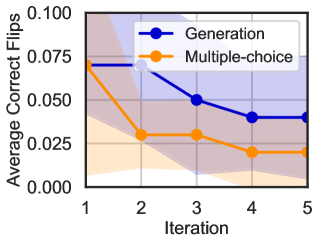
This image presents a line chart illustrating the relationship between the iteration number and the average number of correct flips, comparing two methods: "Generation" and "Multiple-choice". The chart displays a decreasing trend for both methods as the iteration number increases. Shaded regions indicate the uncertainty or variance around each line.
### Components/Axes
* **X-axis:** Iteration, ranging from 1 to 5.
* **Y-axis:** Average Correct Flips, ranging from 0.000 to 0.100.
* **Data Series 1:** Generation (represented by a blue line with blue filled circle markers).
* **Data Series 2:** Multiple-choice (represented by an orange line with orange filled circle markers).
* **Legend:** Located in the top-right corner, identifying the two data series and their corresponding colors.
* **Shaded Region:** A light purple/grey shaded region fills the background of the chart, and a darker grey shaded region surrounds each line, representing the uncertainty.
### Detailed Analysis
**Generation (Blue Line):**
The blue line representing "Generation" starts at approximately 0.075 at Iteration 1 and slopes downward.
* Iteration 1: ~0.075
* Iteration 2: ~0.065
* Iteration 3: ~0.050
* Iteration 4: ~0.040
* Iteration 5: ~0.035
**Multiple-choice (Orange Line):**
The orange line representing "Multiple-choice" starts at approximately 0.075 at Iteration 1 and exhibits a steeper downward slope than the "Generation" line.
* Iteration 1: ~0.075
* Iteration 2: ~0.030
* Iteration 3: ~0.025
* Iteration 4: ~0.015
* Iteration 5: ~0.010
The shaded regions around each line indicate a degree of uncertainty. The width of the shaded region appears to be consistent across iterations for both methods.
### Key Observations
* Both methods show a decrease in average correct flips as the iteration number increases.
* The "Multiple-choice" method exhibits a more rapid decline in average correct flips compared to the "Generation" method.
* At Iteration 1, both methods have approximately the same average correct flips.
* By Iteration 5, the "Generation" method has a higher average correct flips than the "Multiple-choice" method.
* The shaded regions suggest that the variance in the results is relatively consistent across iterations for both methods.
### Interpretation
The data suggests that both the "Generation" and "Multiple-choice" methods become less effective at identifying correct flips as the number of iterations increases. However, the "Generation" method appears to be more robust to iterative refinement, maintaining a higher average correct flips count compared to the "Multiple-choice" method after several iterations. This could indicate that the "Generation" method is less susceptible to overfitting or that it benefits from continued exploration of the solution space. The decreasing trend for both methods might be due to the inherent difficulty of the task or the limitations of the algorithms used. The shaded regions indicate the variability in the results, suggesting that the observed trends are not deterministic and that there is a degree of randomness involved. The initial equivalence of the methods at Iteration 1 suggests that both start with similar performance, but their subsequent trajectories diverge, highlighting the different characteristics of each approach.