## Line Chart: Average Correct Flips vs. Iteration
### Overview
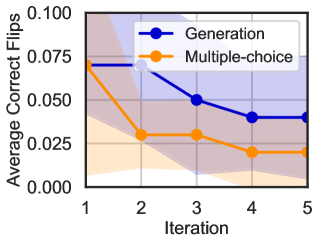
The image is a line chart comparing the performance of two methods, "Generation" and "Multiple-choice," across five iterations. The performance metric is "Average Correct Flips." Both methods show a general downward trend, with "Generation" consistently outperforming "Multiple-choice" after the first iteration. Shaded regions around each line indicate variability or confidence intervals.
### Components/Axes
* **Chart Type:** Line chart with shaded confidence bands.
* **X-Axis (Horizontal):**
* **Label:** "Iteration"
* **Scale:** Discrete, linear scale from 1 to 5.
* **Markers:** Ticks at integers 1, 2, 3, 4, 5.
* **Y-Axis (Vertical):**
* **Label:** "Average Correct Flips"
* **Scale:** Linear scale from 0.000 to 0.100.
* **Markers:** Ticks at 0.000, 0.025, 0.050, 0.075, 0.100.
* **Legend:**
* **Position:** Top-right corner of the plot area.
* **Series 1:** "Generation" - Represented by a blue line with solid circle markers.
* **Series 2:** "Multiple-choice" - Represented by an orange line with solid circle markers.
* **Data Series & Shading:**
* Each line is surrounded by a semi-transparent shaded band of the same color (light blue for Generation, light orange for Multiple-choice), representing the range of uncertainty or variance around the mean value.
### Detailed Analysis
**Trend Verification:**
* **Generation (Blue Line):** The line exhibits a steep downward slope from iteration 1 to 3, followed by a much gentler decline or near-plateau from iteration 3 to 5.
* **Multiple-choice (Orange Line):** The line shows a sharp initial drop from iteration 1 to 2, followed by a steady, gradual decline through iteration 5.
**Data Point Extraction (Approximate Values):**
| Iteration | Generation (Avg. Correct Flips) | Multiple-choice (Avg. Correct Flips) |
| :--- | :--- | :--- |
| 1 | ~0.070 | ~0.070 |
| 2 | ~0.065 | ~0.030 |
| 3 | ~0.050 | ~0.030 |
| 4 | ~0.040 | ~0.020 |
| 5 | ~0.040 | ~0.020 |
**Uncertainty Bands (Visual Estimate of Range):**
* **Generation:** The shaded band is widest at iteration 1 (spanning approx. 0.050 to 0.090) and narrows considerably by iteration 5 (spanning approx. 0.030 to 0.050).
* **Multiple-choice:** The shaded band is also widest at iteration 1 (approx. 0.050 to 0.090) and narrows by iteration 5 (approx. 0.010 to 0.030).
* **Overlap:** The confidence bands for the two methods overlap significantly at iteration 1 and show partial overlap at iterations 2 and 3. By iterations 4 and 5, the bands are distinct, with the Generation band positioned entirely above the Multiple-choice band.
### Key Observations
1. **Initial Parity:** Both methods start at an identical average performance level (~0.070) at iteration 1.
2. **Divergence:** A significant performance gap emerges immediately at iteration 2, with "Generation" maintaining a much higher value.
3. **Convergence of Trend:** While "Generation" remains superior, both methods follow a similar pattern of rapid initial performance loss followed by a slower rate of decline.
4. **Reducing Variance:** The narrowing of the shaded bands for both series suggests that the performance of each method becomes more consistent (less variable) as iterations progress.
5. **Clear Separation:** By the final two iterations (4 and 5), the performance of "Generation" is approximately double that of "Multiple-choice," and their confidence intervals no longer overlap.
### Interpretation
This chart demonstrates a comparative evaluation of two iterative processes. The key finding is that the "Generation" method is more robust or effective than the "Multiple-choice" method for the task measured by "Average Correct Flips."
* **Performance Decay:** The downward trend for both lines indicates that the task becomes more difficult or the methods become less effective with each successive iteration. This could be due to factors like increasing problem complexity, diminishing returns, or error accumulation.
* **Method Superiority:** The "Generation" method's ability to maintain a higher average score, especially after the first iteration, suggests it has a better strategy, more robust underlying model, or is less susceptible to the factors causing performance decay.
* **Reliability:** The narrowing confidence bands imply that as the process continues, the outcomes for each method become more predictable. The clear separation of the bands at the end provides strong visual evidence that the performance difference in later iterations is likely statistically significant.
* **Practical Implication:** If iterations represent a cost (time, computation), the chart suggests that using the "Generation" method yields a better return on investment, particularly in later stages. The "Multiple-choice" method suffers a more severe and immediate drop in performance.
**Language:** The text in the image is in English.