## Line Graph: Average Correct Flips Over Iterations
### Overview
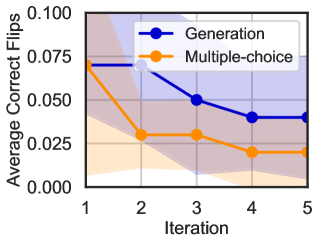
The image is a line graph comparing two data series ("Generation" and "Multiple-choice") across five iterations. The y-axis represents "Average Correct Flips" (0.000–0.100), and the x-axis represents "Iteration" (1–5). Shaded regions indicate confidence intervals for each series.
### Components/Axes
- **Y-axis**: "Average Correct Flips" (0.000 to 0.100 in increments of 0.025).
- **X-axis**: "Iteration" (1 to 5).
- **Legend**:
- Blue line with circles: "Generation"
- Orange line with circles: "Multiple-choice"
- **Shading**:
- Blue-shaded region: Confidence interval for "Generation"
- Orange-shaded region: Confidence interval for "Multiple-choice"
### Detailed Analysis
#### Generation (Blue)
- **Data Points**:
- Iteration 1: ~0.075
- Iteration 2: ~0.075
- Iteration 3: ~0.050
- Iteration 4: ~0.040
- Iteration 5: ~0.040
- **Trend**: Starts at 0.075, plateaus at iteration 2, then decreases steadily to 0.040 by iteration 5. Confidence intervals widen slightly after iteration 2.
#### Multiple-choice (Orange)
- **Data Points**:
- Iteration 1: ~0.075
- Iteration 2: ~0.025
- Iteration 3: ~0.025
- Iteration 4: ~0.020
- Iteration 5: ~0.020
- **Trend**: Sharp drop from 0.075 to 0.025 at iteration 2, followed by a gradual decline to 0.020 by iteration 5. Confidence intervals remain narrow.
### Key Observations
1. **Generation** shows a gradual decline in performance over iterations, with higher variability (wider confidence intervals).
2. **Multiple-choice** exhibits a steep initial drop, followed by stabilization, with tighter confidence intervals.
3. Both series start at the same value (0.075) at iteration 1 but diverge significantly by iteration 2.
### Interpretation
The data suggests that "Generation" and "Multiple-choice" represent distinct strategies or models. The sharp decline in "Multiple-choice" after iteration 1 may indicate a one-time adjustment or saturation effect, while "Generation" shows a more gradual adaptation. The widening confidence intervals for "Generation" imply increasing uncertainty in its measurements over time. This could reflect a learning curve or diminishing returns in iterative processes. The initial parity at iteration 1 highlights a critical starting point where both methods perform equally, but their divergence underscores fundamental differences in their behavior under repeated iterations.