# Technical Document Extraction: Graph Analysis
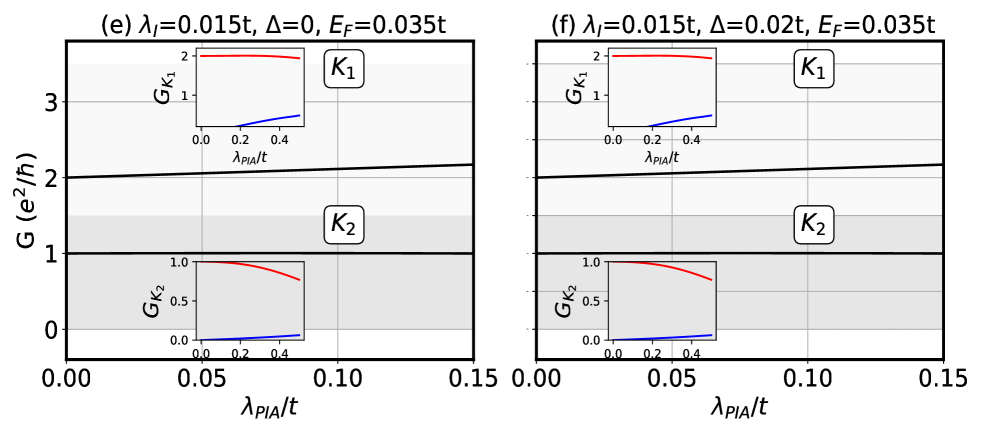
## Panel (e)
- **Parameters**:
- λ_I = 0.015t
- Δ = 0
- E_F = 0.035t
### Main Graph
- **Axes**:
- x-axis: λ_PIA/t (range: 0.00 to 0.15)
- y-axis: G (e²/ħ) (range: 0 to 3)
- **Regions**:
- **K₁**: Shaded gray region (y ≈ 1 to 2)
- Horizontal line at G ≈ 2 (black)
- **K₂**: Shaded gray region (y ≈ 0 to 1)
- Horizontal line at G ≈ 1 (black)
### Insets
1. **G_K₁** (Top-left inset):
- x-axis: λ_PIA/t (0.00 to 0.4)
- y-axis: G (e²/ħ) (0 to 2)
- **Lines**:
- Red (flat line at G ≈ 2)
- Blue (slight upward slope from G ≈ 0 to 0.2)
- **Legend**:
- Red: G_K₁
- Blue: G_K₁ (alternate representation?)
2. **G_K₂** (Bottom-left inset):
- x-axis: λ_PIA/t (0.00 to 0.4)
- y-axis: G (e²/ħ) (0 to 1)
- **Lines**:
- Red (downward slope from G ≈ 1 to 0.5)
- Blue (slight upward slope from G ≈ 0 to 0.2)
- **Legend**:
- Red: G_K₂
- Blue: G_K₂ (alternate representation?)
## Panel (f)
- **Parameters**:
- λ_I = 0.015t
- Δ = 0.02t
- E_F = 0.035t
### Main Graph
- **Axes**:
- x-axis: λ_PIA/t (range: 0.00 to 0.15)
- y-axis: G (e²/ħ) (range: 0 to 3)
- **Regions**:
- **K₁**: Shaded gray region (y ≈ 1 to 2)
- Horizontal line at G ≈ 2 (black, slightly higher than panel e)
- **K₂**: Shaded gray region (y ≈ 0 to 1)
- Horizontal line at G ≈ 1 (black, slightly lower than panel e)
### Insets
1. **G_K₁** (Top-left inset):
- x-axis: λ_PIA/t (0.00 to 0.4)
- y-axis: G (e²/ħ) (0 to 2)
- **Lines**:
- Red (flat line at G ≈ 2)
- Blue (slight upward slope from G ≈ 0 to 0.2)
- **Legend**:
- Red: G_K₁
- Blue: G_K₁ (alternate representation?)
2. **G_K₂** (Bottom-left inset):
- x-axis: λ_PIA/t (0.00 to 0.4)
- y-axis: G (e²/ħ) (0 to 1)
- **Lines**:
- Red (steeper downward slope from G ≈ 1 to 0.5)
- Blue (slight upward slope from G ≈ 0 to 0.2)
- **Legend**:
- Red: G_K₂
- Blue: G_K₂ (alternate representation?)
## Key Observations
1. **Panel Comparison**:
- Panel (f) introduces Δ = 0.02t, altering the main graph's K₁/K₂ boundary lines.
- Insets show similar trends but with modified slopes for G_K₂ (steeper decline in panel f).
2. **Legend Consistency**:
- Red lines correspond to G_K₁/G_K₂ (flat or declining).
- Blue lines correspond to G_K₁/G_K₂ (slight upward trend).
3. **Trends**:
- G_K₁ remains relatively stable (flat/horizontal).
- G_K₂ decreases with increasing λ_PIA/t, more pronounced in panel (f).