## Bar Chart: Token Fraction vs. Average Accuracy
### Overview
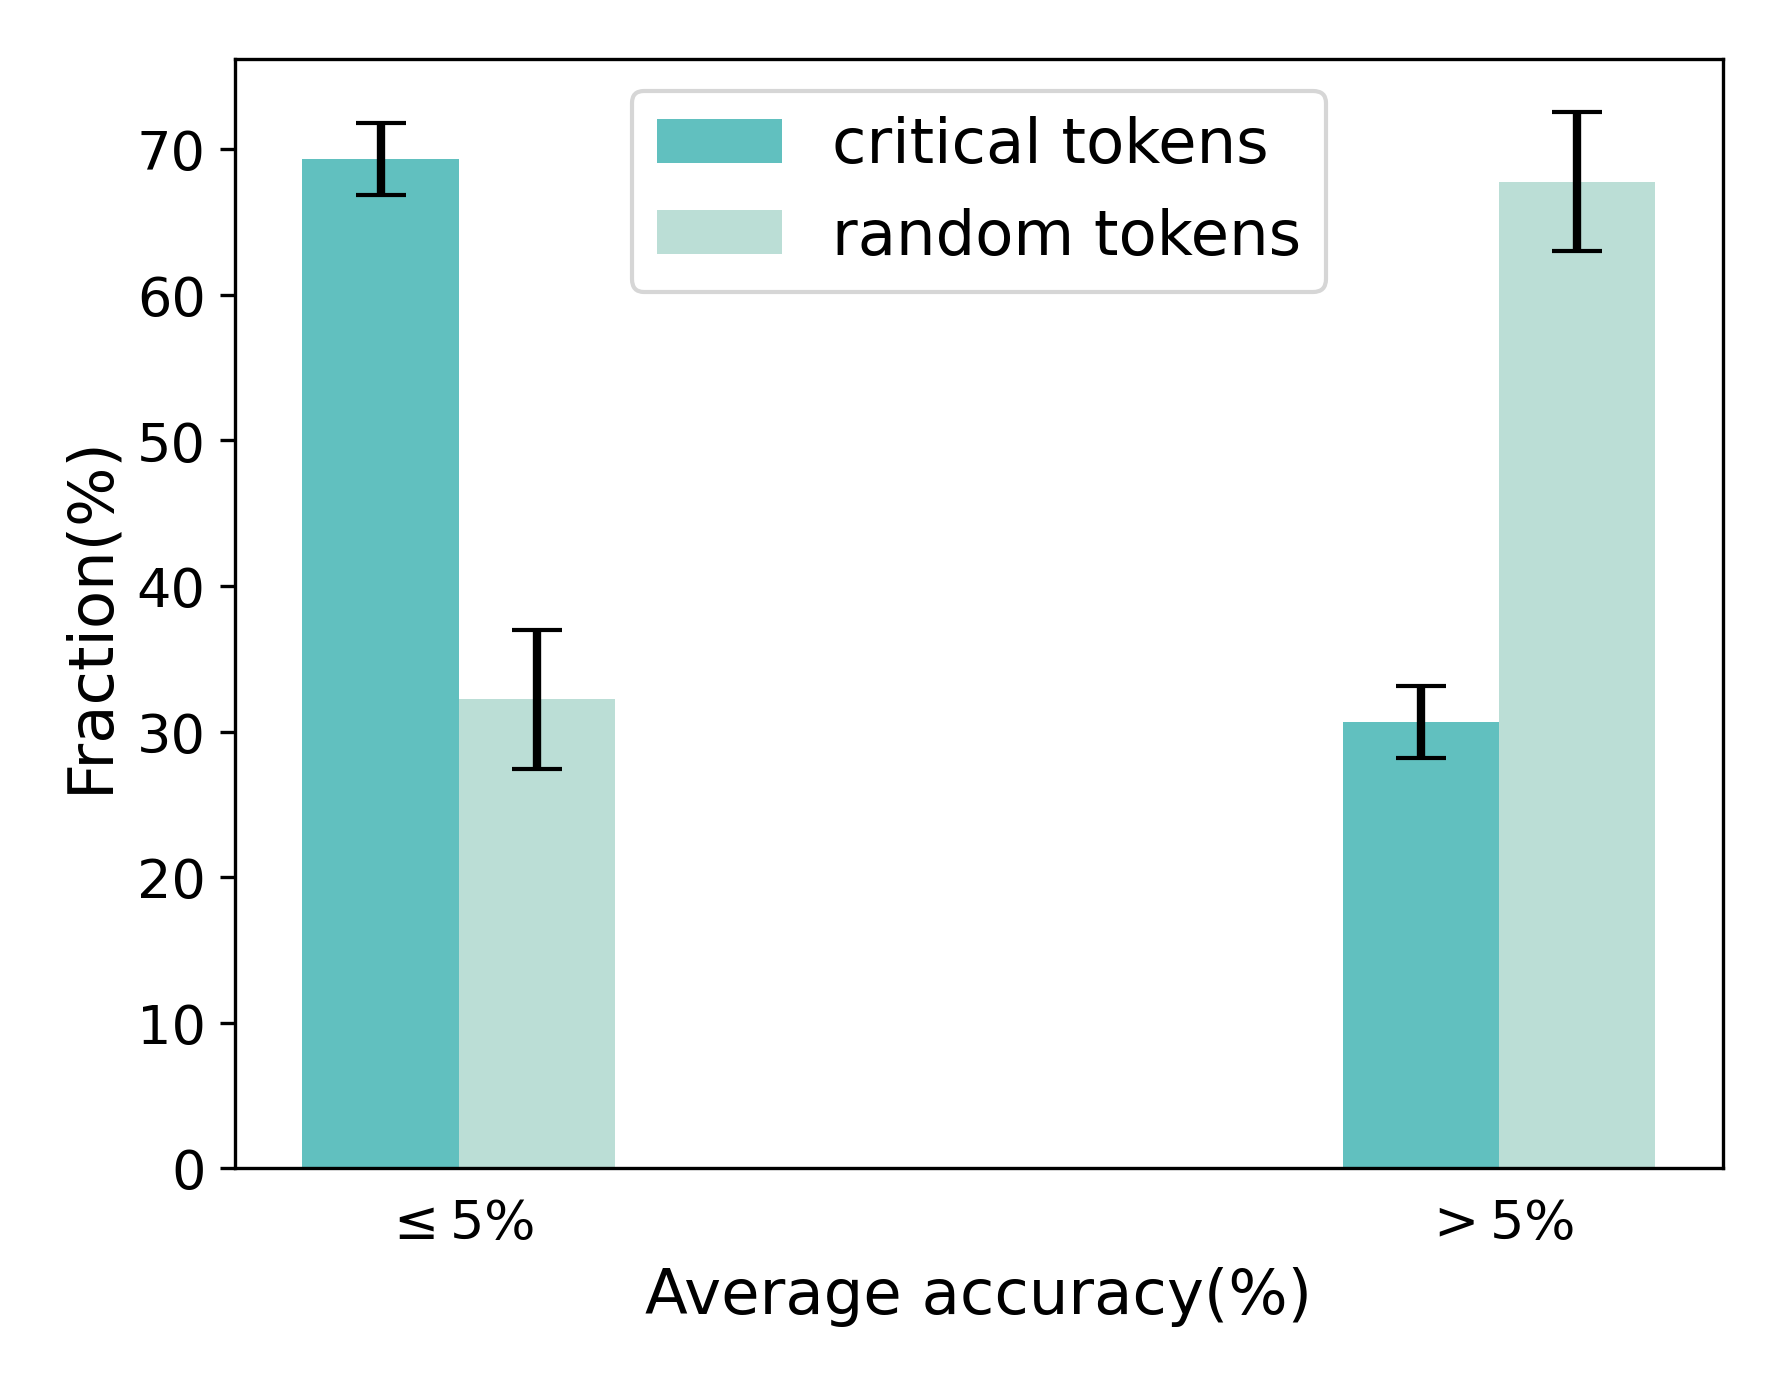
The image is a bar chart comparing the fraction (percentage) of "critical tokens" and "random tokens" at two different average accuracy levels: "≤ 5%" and "> 5%". The chart includes error bars indicating the variability in the data.
### Components/Axes
* **X-axis:** "Average accuracy(%)" with two categories: "≤ 5%" and "> 5%".
* **Y-axis:** "Fraction(%)" with a scale from 0 to 70.
* **Legend:** Located at the top-right of the chart.
* "critical tokens" (represented by a teal bar)
* "random tokens" (represented by a light green bar)
* **Error Bars:** Black vertical lines extending above and below the top of each bar, indicating the range of uncertainty.
### Detailed Analysis
* **Category: ≤ 5% Average Accuracy**
* "critical tokens" (teal bar): Approximately 69% with an error range of +/- 3%.
* "random tokens" (light green bar): Approximately 32% with an error range of +/- 5%.
* **Category: > 5% Average Accuracy**
* "critical tokens" (teal bar): Approximately 31% with an error range of +/- 3%.
* "random tokens" (light green bar): Approximately 68% with an error range of +/- 5%.
### Key Observations
* At lower average accuracy (≤ 5%), the fraction of critical tokens is significantly higher than random tokens.
* At higher average accuracy (> 5%), the relationship reverses: the fraction of random tokens is significantly higher than critical tokens.
* The error bars suggest some variability in the data, but the overall trends are clear.
### Interpretation
The chart suggests an inverse relationship between the fraction of critical tokens and average accuracy. When the average accuracy is low (≤ 5%), critical tokens make up a larger proportion of the total tokens. Conversely, when the average accuracy is high (> 5%), random tokens become more prevalent. This could indicate that critical tokens are more important for achieving a baseline level of accuracy, while random tokens contribute more as accuracy increases. The error bars indicate that the observed differences are statistically significant, despite some variability in the data.