\n
## Scatter Plot: Test Error vs. Lambda Squared
### Overview
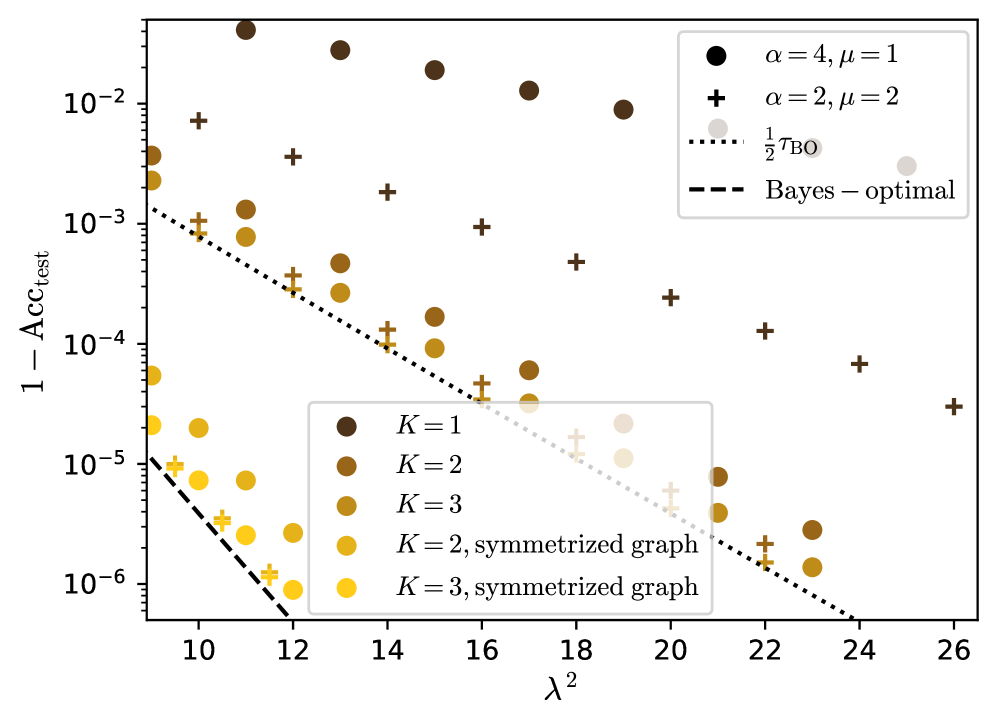
This image presents a scatter plot comparing the test error (1 - Acc_test) against lambda squared (λ²). The plot displays data for different values of alpha (α) and mu (μ), along with theoretical bounds represented by dotted and dashed lines. The data points are color-coded based on the value of K.
### Components/Axes
* **X-axis:** λ² (Lambda Squared) - Scale ranges from approximately 10 to 26.
* **Y-axis:** 1 - Acc_test (1 minus Test Accuracy) - Logarithmic scale ranging from approximately 1e-6 to 0.02.
* **Legend (Top-Right):**
* Black Circles: α = 4, μ = 1
* Black Plus Signs: α = 2, μ = 2
* Black Dotted Line: 1/2 TBO (Theoretical Bound Optimization)
* Black Dashed Line: Bayes – optimal
* **Legend (Bottom-Center):**
* Dark Brown Circles: K = 1
* Brown Circles: K = 2
* Dark Yellow Circles: K = 3
* Yellow Circles: K = 2, symmetrized graph
* Light Yellow Circles: K = 3, symmetrized graph
### Detailed Analysis
The plot shows several data series. Let's analyze each:
* **α = 4, μ = 1 (Black Circles):** This series shows a generally decreasing trend as λ² increases, but with significant fluctuations.
* At λ² ≈ 10.5, 1 - Acc_test ≈ 0.015
* At λ² ≈ 14, 1 - Acc_test ≈ 0.005
* At λ² ≈ 18, 1 - Acc_test ≈ 0.02
* At λ² ≈ 24, 1 - Acc_test ≈ 0.003
* **α = 2, μ = 2 (Black Plus Signs):** This series also shows a decreasing trend, but the values are generally lower than the α = 4, μ = 1 series.
* At λ² ≈ 10.5, 1 - Acc_test ≈ 0.003
* At λ² ≈ 14, 1 - Acc_test ≈ 0.002
* At λ² ≈ 18, 1 - Acc_test ≈ 0.003
* At λ² ≈ 24, 1 - Acc_test ≈ 0.005
* **1/2 TBO (Black Dotted Line):** This line represents a theoretical bound. It shows a decreasing trend, starting at approximately 1 - Acc_test ≈ 0.001 at λ² ≈ 10 and decreasing to approximately 1 - Acc_test ≈ 0.0005 at λ² ≈ 26.
* **Bayes – optimal (Black Dashed Line):** This line represents the optimal Bayesian performance. It shows a steep decrease from approximately 1 - Acc_test ≈ 0.0002 at λ² ≈ 10 to approximately 1 - Acc_test ≈ 0.00005 at λ² ≈ 26.
* **K = 1 (Dark Brown Circles):** This series shows a decreasing trend, starting at approximately 1 - Acc_test ≈ 0.0002 at λ² ≈ 10 and decreasing to approximately 1 - Acc_test ≈ 0.00005 at λ² ≈ 26.
* **K = 2 (Brown Circles):** This series shows a decreasing trend, starting at approximately 1 - Acc_test ≈ 0.001 at λ² ≈ 10 and decreasing to approximately 1 - Acc_test ≈ 0.00005 at λ² ≈ 26.
* **K = 3 (Dark Yellow Circles):** This series shows a decreasing trend, starting at approximately 1 - Acc_test ≈ 0.002 at λ² ≈ 10 and decreasing to approximately 1 - Acc_test ≈ 0.00005 at λ² ≈ 26.
* **K = 2, symmetrized graph (Yellow Circles):** This series shows a decreasing trend, starting at approximately 1 - Acc_test ≈ 0.0005 at λ² ≈ 10 and decreasing to approximately 1 - Acc_test ≈ 0.00005 at λ² ≈ 26.
* **K = 3, symmetrized graph (Light Yellow Circles):** This series shows a decreasing trend, starting at approximately 1 - Acc_test ≈ 0.001 at λ² ≈ 10 and decreasing to approximately 1 - Acc_test ≈ 0.00005 at λ² ≈ 26.
### Key Observations
* The theoretical bounds (1/2 TBO and Bayes – optimal) provide a benchmark for the performance of the other data series.
* The α = 4, μ = 1 series consistently exhibits higher test error compared to the α = 2, μ = 2 series.
* The K values seem to influence the test error, with higher K values generally leading to lower test error.
* The "symmetrized graph" versions of K=2 and K=3 show lower test error than their non-symmetrized counterparts.
### Interpretation
The plot demonstrates the relationship between lambda squared (λ²) and test error (1 - Acc_test) under different parameter settings (α, μ, K). The decreasing trend in most series suggests that increasing λ² generally improves test accuracy. However, the fluctuations in the α = 4, μ = 1 series indicate that this relationship is not always straightforward and may be sensitive to the specific parameter values.
The theoretical bounds (1/2 TBO and Bayes – optimal) provide a reference point for evaluating the performance of the empirical data. The fact that the empirical data series generally fall above these bounds suggests that there is room for improvement in the model's performance.
The influence of K on test error suggests that the complexity of the model (as represented by K) plays a role in its ability to generalize to unseen data. The symmetrized graph versions of K=2 and K=3 performing better than their non-symmetrized counterparts suggests that the symmetrization process helps to reduce overfitting and improve generalization.
The logarithmic scale on the y-axis emphasizes the differences in test error, particularly at lower error rates. This is important for understanding the practical significance of the observed differences in performance.