## Line Chart: Model Accuracy vs. Compute (exaFLOP)
### Overview
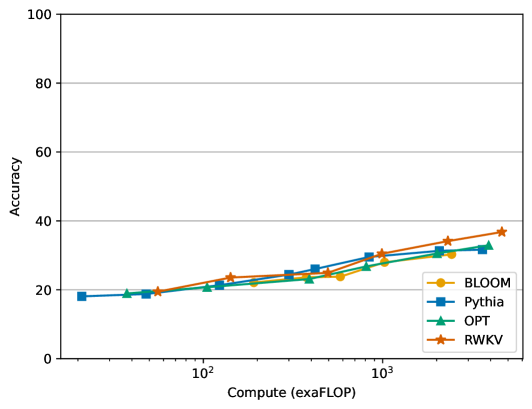
The chart compares the accuracy of four language models (BLOOM, Pythia, OPT, RWKV) across varying compute levels (exaFLOP). Accuracy is plotted on the y-axis (0–100), while compute is logarithmic on the x-axis (10²–10³). All models show upward trends, with RWKV achieving the highest accuracy at higher compute levels.
### Components/Axes
- **X-axis**: "Compute (exaFLOP)" with logarithmic scale (10², 10³).
- **Y-axis**: "Accuracy" (0–100, linear scale).
- **Legend**:
- Orange circle: BLOOM
- Blue square: Pythia
- Green triangle: OPT
- Red star: RWKV
- **Legend Position**: Bottom-right corner.
### Detailed Analysis
1. **BLOOM (Orange)**:
- Starts at ~18 accuracy at 10² exaFLOP.
- Gradual increase to ~30 accuracy at 10³ exaFLOP.
- Slope: Moderate upward trend.
2. **Pythia (Blue)**:
- Begins at ~18 accuracy at 10² exaFLOP.
- Rises to ~32 accuracy at 10³ exaFLOP.
- Slope: Steeper than BLOOM but less than RWKV.
3. **OPT (Green)**:
- Starts at ~19 accuracy at 10² exaFLOP.
- Increases to ~31 accuracy at 10³ exaFLOP.
- Slope: Similar to Pythia but slightly flatter.
4. **RWKV (Red)**:
- Begins at ~20 accuracy at 10² exaFLOP.
- Sharp rise to ~38 accuracy at 10³ exaFLOP.
- Slope: Steepest among all models.
### Key Observations
- All models show **positive correlation** between compute and accuracy.
- **RWKV** consistently outperforms others at higher compute levels.
- **BLOOM** has the lowest accuracy across all compute ranges.
- No model exhibits a decline in accuracy; all trends are monotonically increasing.
### Interpretation
The data suggests that **compute efficiency** significantly impacts model accuracy, with RWKV demonstrating the most efficient scaling. BLOOM’s lower performance may indicate architectural limitations or training data differences. The logarithmic x-axis emphasizes that even small increases in compute (e.g., 10² to 10³) yield substantial accuracy gains, highlighting the importance of computational resources in model development. The absence of overlapping lines confirms no model overtakes another in this range, suggesting inherent differences in scalability.