\n
## Chart/Diagram Type: Performance Comparison of Neural Network Training Methods
### Overview
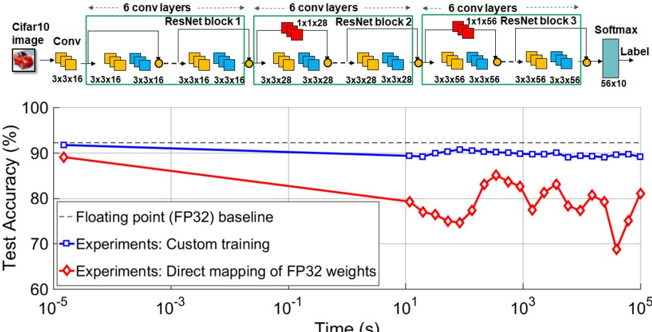
The image presents a comparison of the test accuracy achieved by different training methods for a neural network on the CIFAR-10 dataset, plotted against training time. The top portion of the image shows a diagram of the neural network architecture, while the bottom portion displays a line chart illustrating the performance of three different training approaches: a floating-point (FP32) baseline, custom training, and direct mapping of FP32 weights.
### Components/Axes
* **X-axis:** Time (s), logarithmic scale from 10<sup>-5</sup> to 10<sup>5</sup>.
* **Y-axis:** Test Accuracy (%), ranging from 60% to 100%.
* **Data Series:**
* Floating point (FP32) baseline (dashed red line)
* Experiments: Custom training (blue line with square markers)
* Experiments: Direct mapping of FP32 weights (red line with diamond markers)
* **Neural Network Diagram:** Shows a series of convolutional layers and ResNet blocks.
* Input: CIFAR10 image
* First Layer: Conv (3x3x16)
* ResNet Block 1: 3x3x16 convolutions
* 6 Conv Layers repeated 3 times with increasing filter sizes (1x1x28, 3x3x28, 3x3x56)
* Final Layer: Softmax (56x10)
* Output: Label
* **Legend:** Located in the bottom-left corner, clearly identifying each data series by color and marker type.
### Detailed Analysis or Content Details
The chart displays the test accuracy as a function of training time.
* **Floating Point (FP32) Baseline:** Starts at approximately 91% accuracy at 10<sup>-5</sup> seconds and decreases steadily to around 81% accuracy at 10<sup>5</sup> seconds. The line is relatively smooth.
* **Custom Training:** Begins at approximately 89% accuracy at 10<sup>-5</sup> seconds and remains relatively stable, fluctuating between approximately 88% and 91% accuracy throughout the entire training period (up to 10<sup>5</sup> seconds).
* **Direct Mapping of FP32 Weights:** Starts at approximately 74% accuracy at 10<sup>-5</sup> seconds and increases to around 83% accuracy at 10<sup>2</sup> seconds, then fluctuates significantly between approximately 75% and 85% accuracy for the remainder of the training period.
Specific data points (approximate):
| Time (s) | FP32 Baseline (%) | Custom Training (%) | Direct Mapping (%) |
|---|---|---|---|
| 10<sup>-5</sup> | 91 | 89 | 74 |
| 10<sup>-3</sup> | 90 | 89 | 78 |
| 10<sup>-1</sup> | 88 | 90 | 81 |
| 10<sup>1</sup> | 86 | 89 | 82 |
| 10<sup>2</sup> | 84 | 88 | 83 |
| 10<sup>3</sup> | 82 | 90 | 78 |
| 10<sup>5</sup> | 81 | 91 | 82 |
### Key Observations
* The FP32 baseline exhibits a consistent decrease in accuracy over time, suggesting potential overfitting or diminishing returns.
* Custom training maintains a relatively high and stable accuracy throughout the training process.
* Direct mapping of FP32 weights shows an initial increase in accuracy, followed by significant fluctuations, indicating instability or sensitivity to training parameters.
* Custom training consistently outperforms direct mapping of FP32 weights.
* At the beginning of training, direct mapping starts with significantly lower accuracy than both the baseline and custom training.
### Interpretation
The data suggests that custom training is the most effective method for achieving and maintaining high accuracy on the CIFAR-10 dataset, given the network architecture shown. The FP32 baseline, while starting with high accuracy, degrades over time, potentially due to overfitting. Direct mapping of FP32 weights shows promise with an initial increase in accuracy, but its instability and lower overall performance compared to custom training indicate that it requires further optimization or is not well-suited for this specific network and dataset.
The neural network diagram illustrates a deep convolutional neural network with ResNet blocks, which are known for their ability to mitigate the vanishing gradient problem and enable the training of deeper networks. The architecture appears to be designed for image classification tasks, as evidenced by the final Softmax layer and the CIFAR-10 image input. The diagram provides context for understanding the performance results, as the network's complexity and design choices influence its training dynamics and accuracy. The logarithmic scale on the x-axis highlights the importance of considering training time, especially for computationally intensive tasks like deep learning. The fluctuations in the direct mapping method could be due to the challenges of transferring weights from a higher-precision representation (FP32) to a lower-precision one, potentially leading to quantization errors or instability during training.