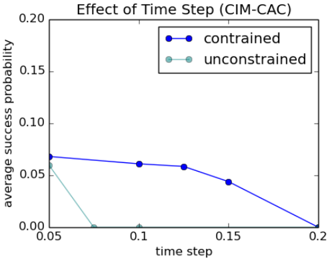
## Line Graph: Effect of Time Step (CIM-CAC)
### Overview
The image is a line graph illustrating how the **average success probability** changes with varying **time step** values in a system labeled "CIM-CAC". Two data series are compared: "constrained" (blue line) and "unconstrained" (green line). The graph shows a clear divergence in trends between the two scenarios as the time step increases.
---
### Components/Axes
- **Title**: "Effect of Time Step (CIM-CAC)"
- **X-axis**:
- Label: "time step"
- Scale: 0.05 to 0.2 (increments of 0.05)
- **Y-axis**:
- Label: "average success probability"
- Scale: 0.00 to 0.20 (increments of 0.05)
- **Legend**:
- Position: Top-right corner
- Entries:
- "constrained" (blue line with circular markers)
- "unconstrained" (green line with circular markers)
---
### Detailed Analysis
#### Constrained (Blue Line)
- **Trend**: Gradual decline from left to right.
- **Data Points**:
- At time step 0.05: ~0.06
- At time step 0.1: ~0.055
- At time step 0.15: ~0.045
- At time step 0.2: 0.00
#### Unconstrained (Green Line)
- **Trend**: Sharp initial drop, then plateaus at 0.00.
- **Data Points**:
- At time step 0.05: ~0.05
- At time step 0.075: 0.00 (drops sharply)
- Remains at 0.00 for all subsequent time steps (0.1, 0.15, 0.2).
---
### Key Observations
1. **Constrained System**:
- Success probability decreases linearly with increasing time step.
- Maintains non-zero probability until the maximum time step (0.2).
2. **Unconstrained System**:
- Success probability drops abruptly at time step 0.075 and remains at 0.00 for all larger time steps.
- Initial success probability (~0.05) is slightly lower than the constrained system at the same time step.
3. **Divergence**:
- The constrained system retains higher success probability across most time steps.
- The unconstrained system’s success probability collapses earlier, suggesting sensitivity to time step changes.
---
### Interpretation
The data suggests that **time step size critically impacts system performance**, with the **constrained scenario** being more robust to increases in time step. The unconstrained system’s rapid decline in success probability implies that it may lack mechanisms (e.g., feedback, regulation) to adapt to larger time steps, leading to failure. This could reflect a trade-off between computational efficiency (larger time steps) and stability (smaller time steps). The constrained system’s gradual decline might indicate controlled adjustments to maintain functionality, whereas the unconstrained system’s abrupt failure highlights vulnerabilities in its design or parameters.
The graph underscores the importance of time step selection in dynamic systems, particularly when balancing performance and computational constraints.