## Line Chart: Pretrain (Warmup)
### Overview
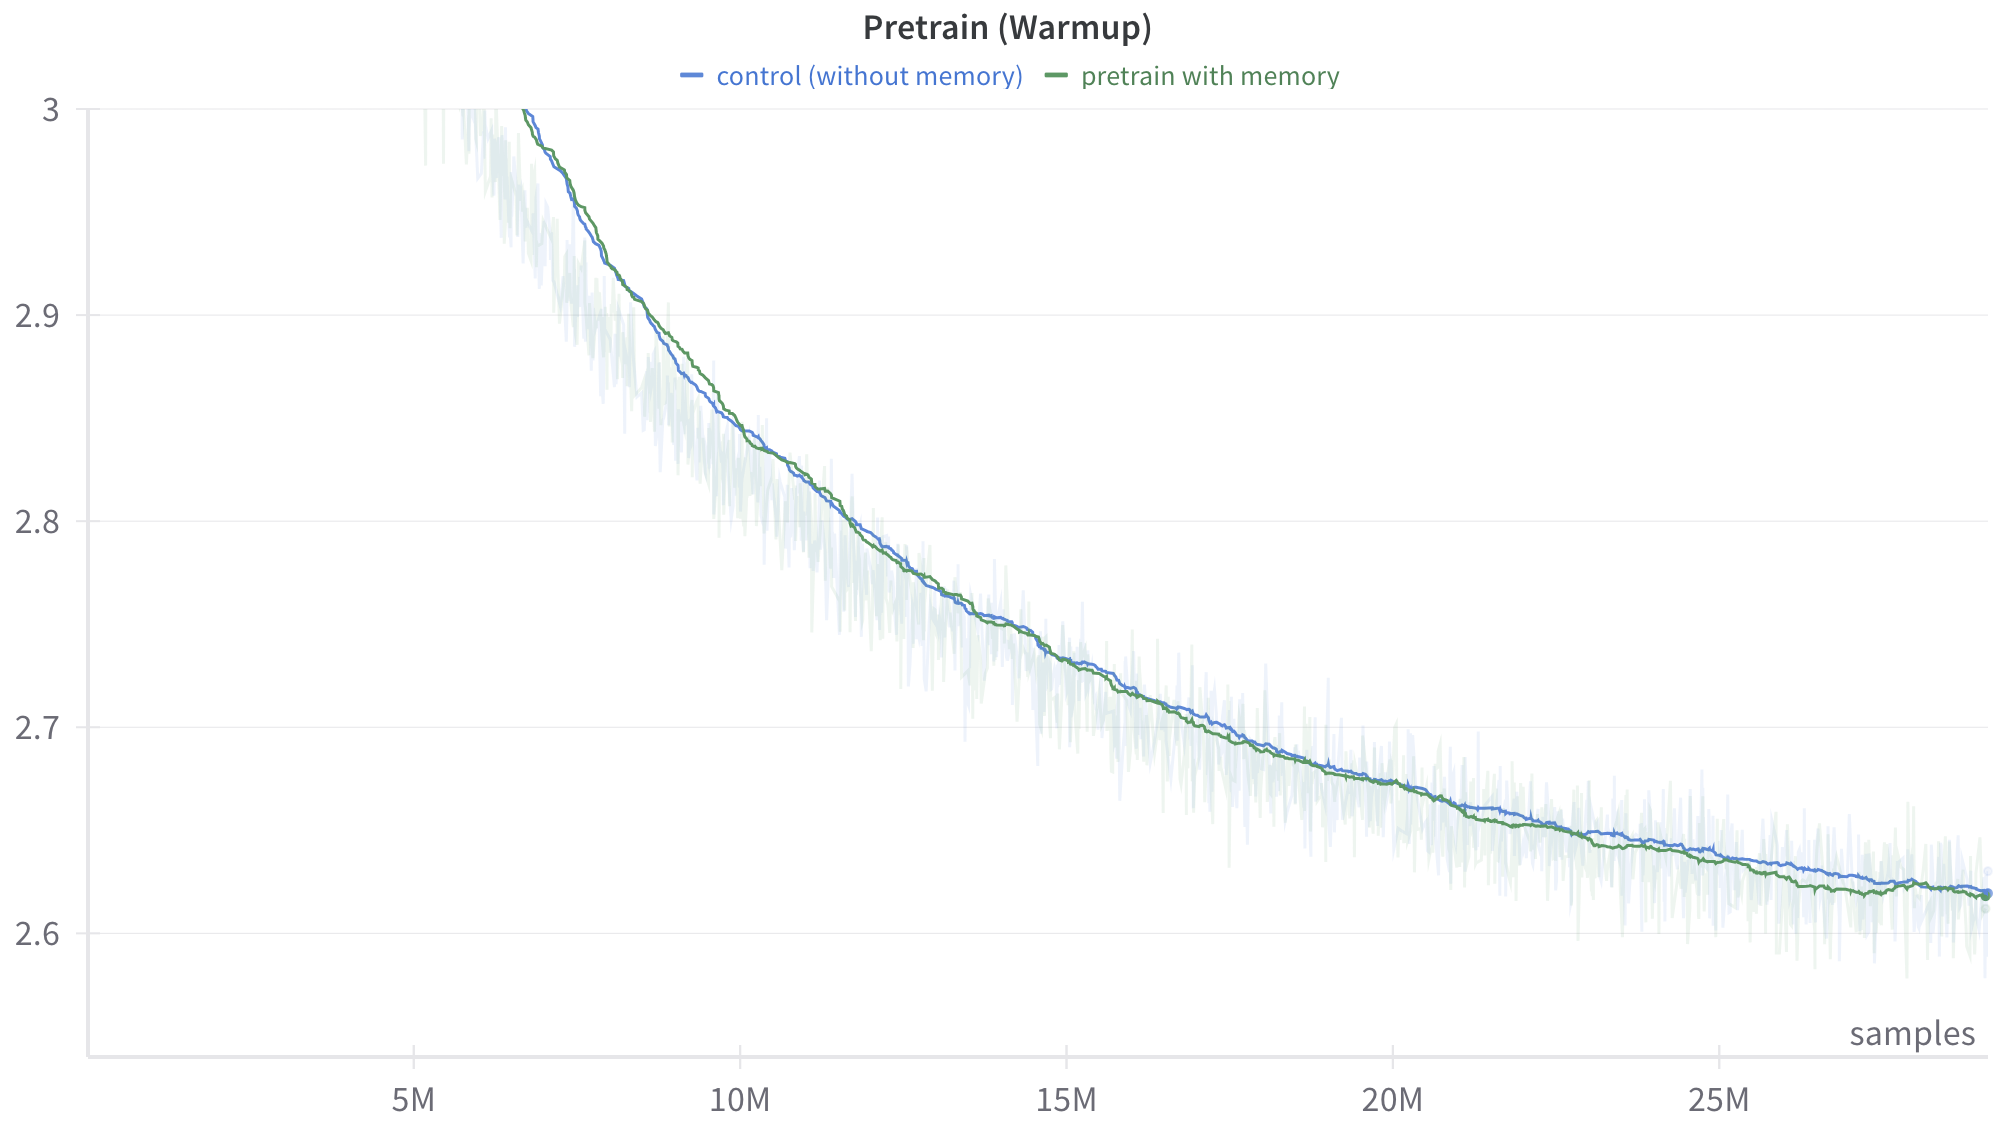
The image is a line chart comparing the performance of two models during pretraining: a control model (without memory) and a model pretrained with memory. The chart displays the trend of some metric (likely loss or error) over the number of samples processed. Both models show a decreasing trend, indicating learning, but the chart aims to highlight any differences in their learning curves.
### Components/Axes
* **Title:** Pretrain (Warmup)
* **X-axis:** samples, with markers at 5M, 10M, 15M, 20M, and 25M.
* **Y-axis:** Numerical values ranging from 2.6 to 3.0, with markers at 2.6, 2.7, 2.8, 2.9, and 3.
* **Legend:** Located at the top of the chart.
* Blue line: control (without memory)
* Green line: pretrain with memory
### Detailed Analysis
* **Control (without memory) - Blue Line:**
* Trend: The blue line starts at approximately 3.0 and generally slopes downward, indicating a decrease in the metric being measured.
* Data Points:
* At 5M samples, the value is approximately 2.9.
* At 10M samples, the value is approximately 2.8.
* At 15M samples, the value is approximately 2.7.
* At 20M samples, the value is approximately 2.65.
* At 25M samples, the value is approximately 2.62.
* **Pretrain with memory - Green Line:**
* Trend: The green line also starts at approximately 3.0 and slopes downward, similar to the blue line.
* Data Points:
* At 5M samples, the value is approximately 2.9.
* At 10M samples, the value is approximately 2.8.
* At 15M samples, the value is approximately 2.7.
* At 20M samples, the value is approximately 2.67.
* At 25M samples, the value is approximately 2.62.
### Key Observations
* Both lines start at roughly the same point (approximately 3.0) and decrease over time.
* The green line (pretrain with memory) appears to be slightly above the blue line (control without memory) for most of the chart, suggesting a slightly higher value for the metric being measured.
* The difference between the two lines seems to diminish as the number of samples increases, indicating that the models converge.
* There is a light blue/green shaded region around each line, which likely represents the variance or standard deviation of the data.
### Interpretation
The chart suggests that pretraining with memory may initially lead to slightly higher values for the metric being measured compared to the control model. However, as the training progresses (more samples are processed), the difference between the two models decreases, indicating that both models eventually achieve similar performance levels. The shaded regions around the lines suggest that there is some variability in the data, but the overall trends are consistent. The "Warmup" in the title suggests that this is the initial phase of training, and the long-term performance of the models may differ.