\n
## Line Chart: Pretrain (Warmup)
### Overview
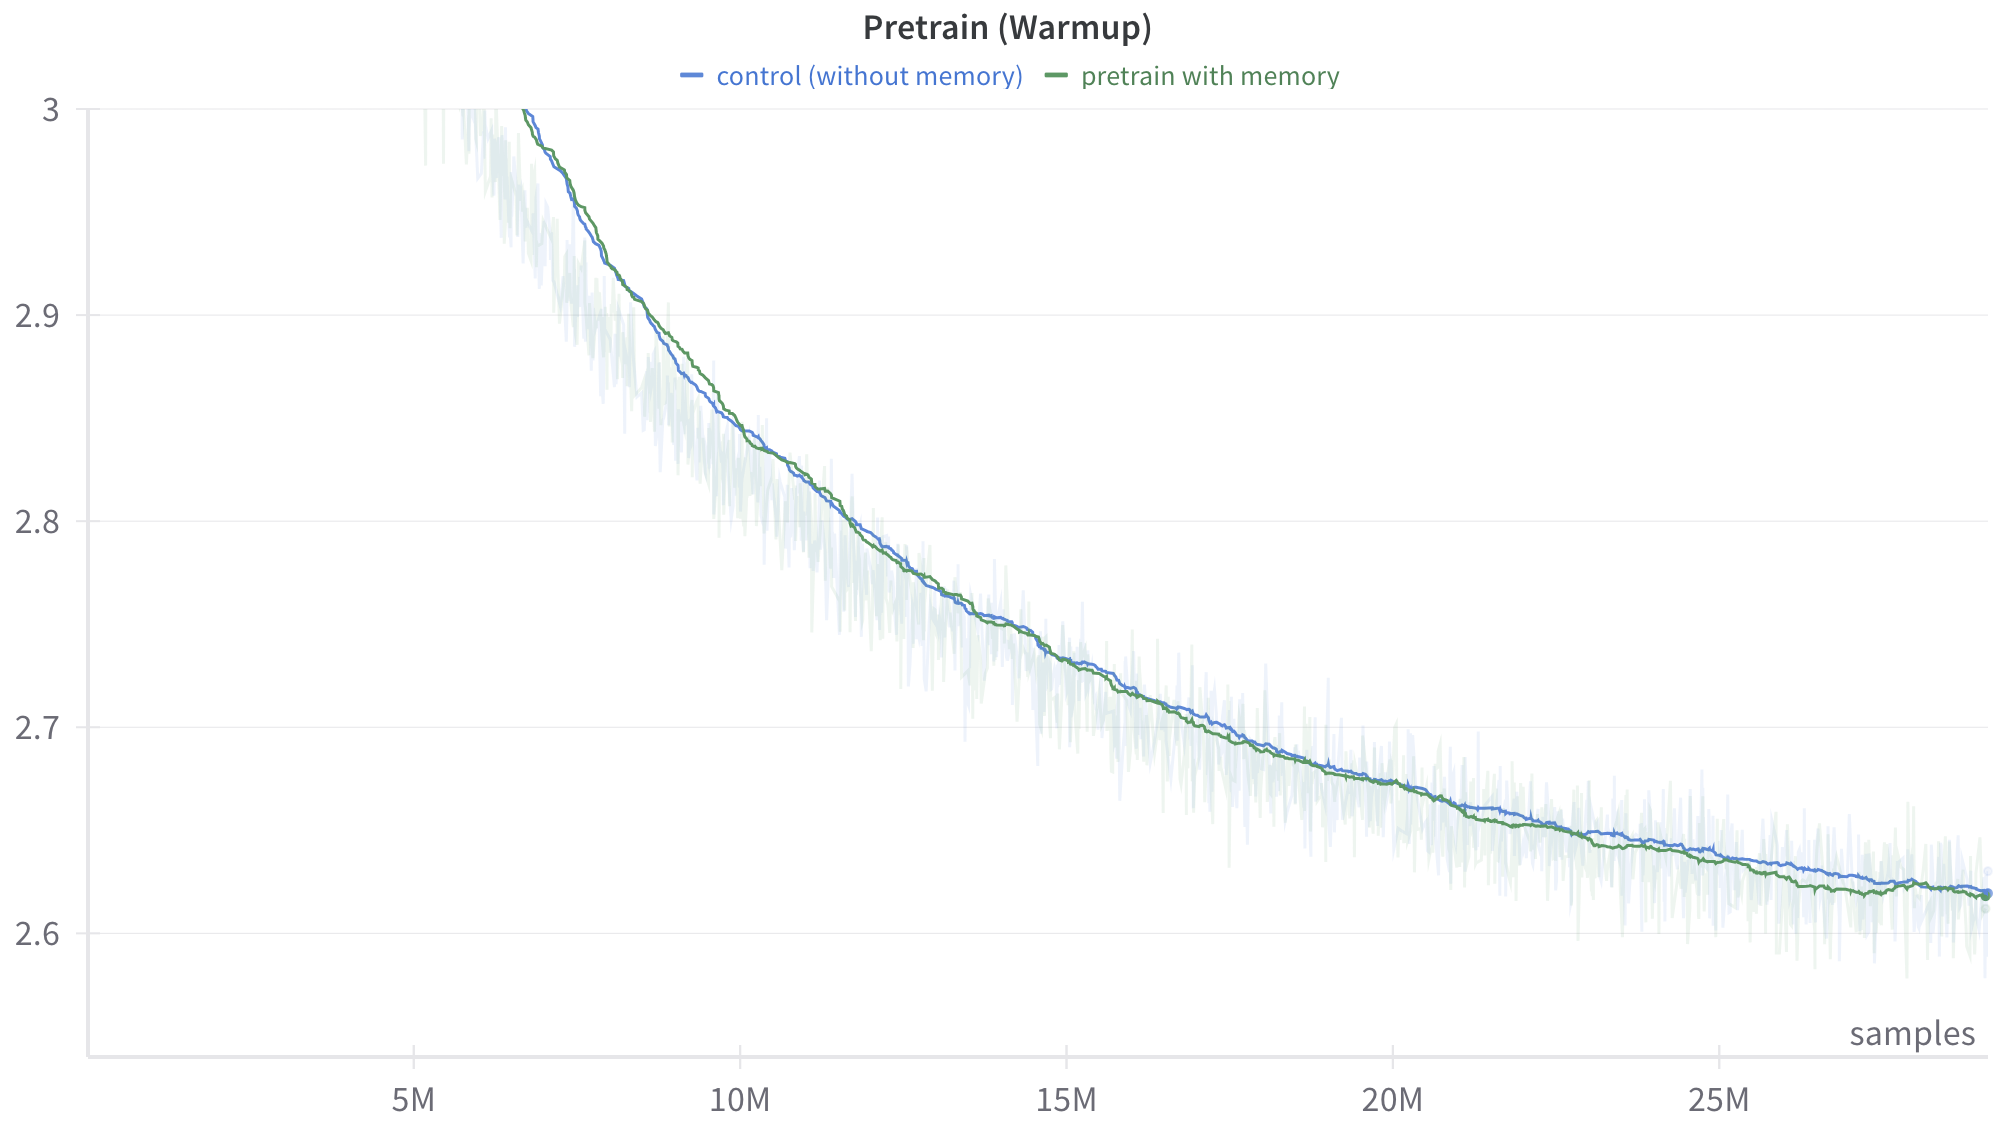
The image presents a line chart comparing the performance of two pretraining methods – "control (without memory)" and "pretrain with memory" – during a warmup phase. The chart plots a value (likely loss or error) against the number of samples processed, ranging from 0 to 25 million. A shaded area around each line represents the variance or standard deviation.
### Components/Axes
* **Title:** "Pretrain (Warmup)" – positioned at the top-center of the chart.
* **X-axis:** Labeled "samples" – positioned at the bottom of the chart. The scale ranges from 0M to 25M, with tick marks at 5M, 10M, 15M, 20M, and 25M.
* **Y-axis:** No explicit label, but the scale ranges from approximately 2.6 to 3.0, with tick marks at 2.6, 2.7, 2.8, 2.9, and 3.0.
* **Legend:** Located at the top-right of the chart.
* "control (without memory)" – represented by a light blue line.
* "pretrain with memory" – represented by a dark teal line.
### Detailed Analysis
Both lines exhibit a downward trend, indicating improvement as the number of samples increases. The shaded areas around the lines indicate variability in the performance.
* **Control (without memory):**
* Starts at approximately 2.95 at 0M samples.
* Decreases to approximately 2.75 at 10M samples.
* Continues to decrease to approximately 2.65 at 25M samples.
* The shaded area is relatively wide initially, indicating high variance, and narrows as the number of samples increases.
* **Pretrain with memory:**
* Starts at approximately 2.93 at 0M samples.
* Decreases to approximately 2.73 at 10M samples.
* Continues to decrease to approximately 2.63 at 25M samples.
* Similar to the control, the shaded area is wider initially and narrows with increasing samples.
The two lines are very close to each other throughout the entire range of samples. The "pretrain with memory" line consistently appears slightly below the "control (without memory)" line, suggesting slightly better performance.
### Key Observations
* Both pretraining methods show improvement with more samples.
* The "pretrain with memory" method appears to perform marginally better than the "control (without memory)" method.
* The variance in performance decreases as the number of samples increases for both methods.
* The difference between the two methods is small, suggesting that the benefit of using memory during pretraining is not substantial in this scenario.
### Interpretation
The chart demonstrates the warmup phase of two pretraining strategies. The downward trend of both lines indicates that both methods are learning and improving their performance as they process more data. The slight advantage of the "pretrain with memory" method suggests that incorporating memory mechanisms during pretraining can lead to a small performance gain. However, the close proximity of the two lines and the narrowing of the shaded areas suggest that the benefits of memory may diminish as the model converges. The initial high variance indicates that the model is more sensitive to the data at the beginning of training, and this sensitivity decreases as the model learns. This chart is useful for evaluating the effectiveness of different pretraining strategies and understanding the impact of memory mechanisms on model performance.