# Technical Document Extraction: Control Effect Analysis
## Panel a
### Axes
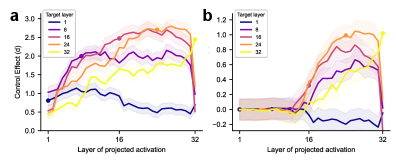
- **X-axis**: "Layer of projected activation" (ranges from 1 to 32)
- **Y-axis**: "Control Effect (d)" (ranges from 0.0 to 3.0)
### Legend
- **Target Layers**:
- Layer 1: Dark blue
- Layer 8: Purple
- Layer 16: Red
- Layer 24: Orange
- Layer 32: Yellow
### Key Trends
- All lines converge toward layer 32, with variability shaded in gray.
- Layer 1 (dark blue) shows the lowest control effect, peaking at ~1.0 before declining.
- Layer 8 (purple) exhibits moderate growth, peaking near 2.0.
- Layer 16 (red) and 24 (orange) show steeper increases, reaching ~2.5 and ~2.75, respectively.
- Layer 32 (yellow) demonstrates the highest control effect, peaking at ~2.5 before a sharp decline.
## Panel b
### Axes
- **X-axis**: "Layer of projected activation" (ranges from 1 to 32)
- **Y-axis**: "Control Effect (d)" (ranges from -0.2 to 1.2)
### Legend
- **Target Layers**:
- Layer 1: Dark blue
- Layer 8: Purple
- Layer 16: Red
- Layer 24: Orange
- Layer 32: Yellow
### Key Trends
- Lines start near 0.0 at layer 1, with variability shaded in gray.
- Layer 1 (dark blue) remains near 0.0 until layer 16, then drops sharply to -0.2.
- Layer 8 (purple) and 16 (red) show gradual increases, peaking near 0.8 and 1.0, respectively.
- Layer 24 (orange) and 32 (yellow) exhibit the highest control effects, peaking at ~1.1 and ~1.2 before steep declines.
### Cross-Reference Validation
- **Legend Colors**: Confirmed alignment with line colors in both panels.
- **Axis Labels**: Consistent across panels for "Layer of projected activation" and "Control Effect (d)".
- **Shaded Regions**: Represent variability/confidence intervals in both panels.