## Bar and Line Chart: Gradient Size vs. Epochs
### Overview
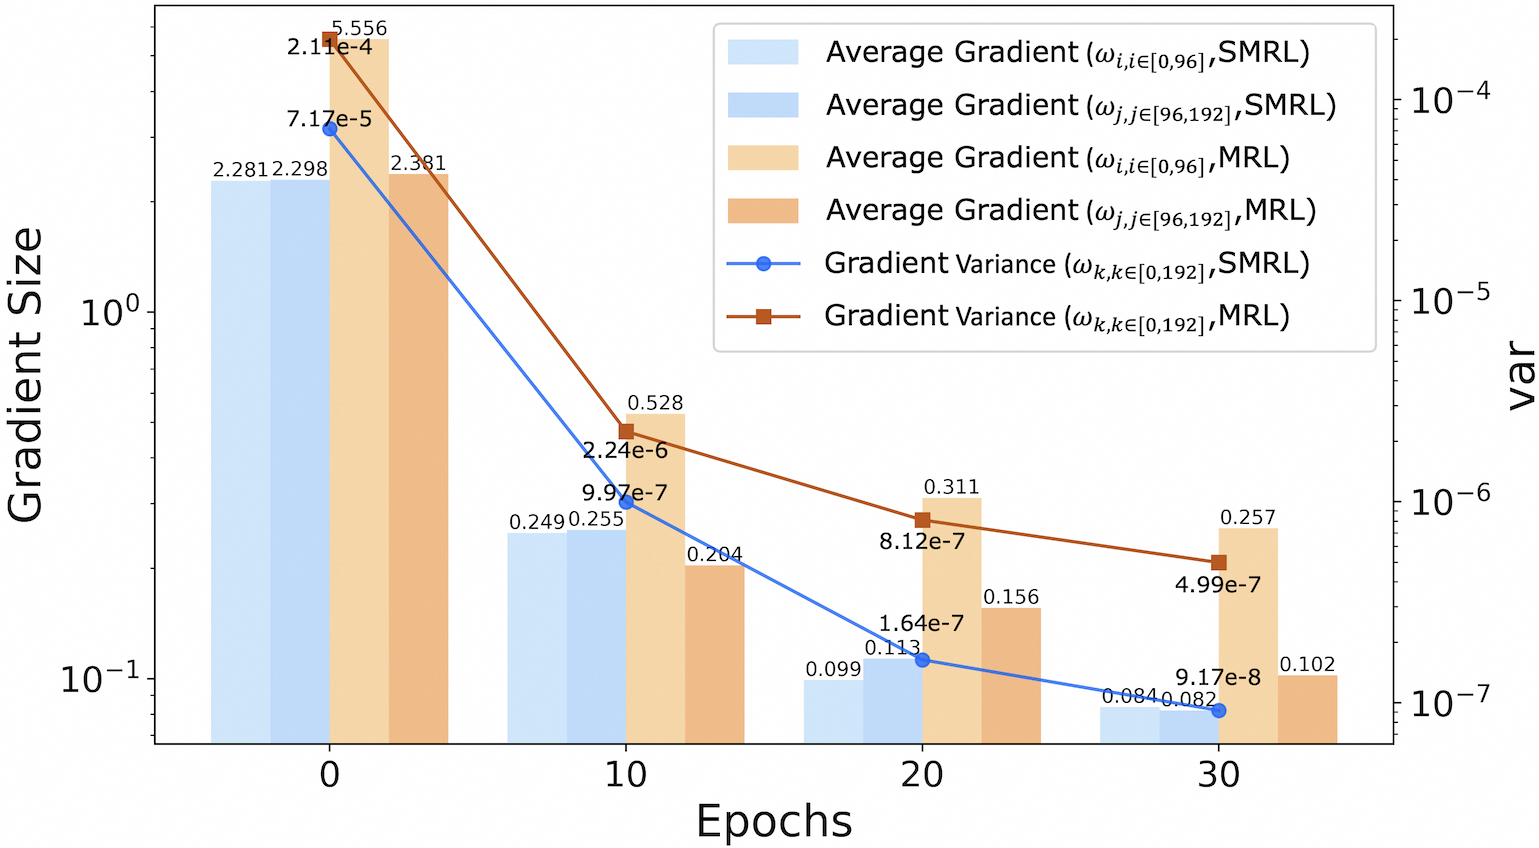
The image is a combination of a bar chart and a line chart, displaying the average gradient and gradient variance over epochs for two different models (SMRL and MRL). The x-axis represents epochs, while the left y-axis represents gradient size (logarithmic scale) and the right y-axis represents variance (also logarithmic scale).
### Components/Axes
* **X-axis:** Epochs, labeled "Epochs", with tick marks at 0, 10, 20, and 30.
* **Left Y-axis:** Gradient Size, labeled "Gradient Size", with a logarithmic scale ranging from 10<sup>-1</sup> to 10<sup>0</sup> (0.1 to 1).
* **Right Y-axis:** Variance, labeled "var", with a logarithmic scale ranging from 10<sup>-7</sup> to 10<sup>-4</sup>.
* **Legend (top-right):**
* Light Blue: Average Gradient (ω<sub>i,i∈[0,96]</sub>, SMRL)
* Blue: Average Gradient (ω<sub>j,j∈[96,192]</sub>, SMRL)
* Light Orange: Average Gradient (ω<sub>i,i∈[0,96]</sub>, MRL)
* Orange: Average Gradient (ω<sub>j,j∈[96,192]</sub>, MRL)
* Blue Line with Circle Markers: Gradient Variance (ω<sub>k,k∈[0,192]</sub>, SMRL)
* Brown Line with Square Markers: Gradient Variance (ω<sub>k,k∈[0,192]</sub>, MRL)
### Detailed Analysis or ### Content Details
**Bar Chart Data (Average Gradients):**
* **Epoch 0:**
* Average Gradient (ω<sub>i,i∈[0,96]</sub>, SMRL): 2.28
* Average Gradient (ω<sub>j,j∈[96,192]</sub>, SMRL): 2.298
* Average Gradient (ω<sub>i,i∈[0,96]</sub>, MRL): 7.17e-5
* Average Gradient (ω<sub>j,j∈[96,192]</sub>, MRL): 2.381
* **Epoch 10:**
* Average Gradient (ω<sub>i,i∈[0,96]</sub>, SMRL): 0.249
* Average Gradient (ω<sub>j,j∈[96,192]</sub>, SMRL): 0.255
* Average Gradient (ω<sub>i,i∈[0,96]</sub>, MRL): 9.97e-7
* Average Gradient (ω<sub>j,j∈[96,192]</sub>, MRL): 0.528
* **Epoch 20:**
* Average Gradient (ω<sub>i,i∈[0,96]</sub>, SMRL): 0.099
* Average Gradient (ω<sub>j,j∈[96,192]</sub>, SMRL): 0.113
* Average Gradient (ω<sub>i,i∈[0,96]</sub>, MRL): 1.64e-7
* Average Gradient (ω<sub>j,j∈[96,192]</sub>, MRL): 0.311
* **Epoch 30:**
* Average Gradient (ω<sub>i,i∈[0,96]</sub>, SMRL): 0.084
* Average Gradient (ω<sub>j,j∈[96,192]</sub>, SMRL): 0.082
* Average Gradient (ω<sub>i,i∈[0,96]</sub>, MRL): 9.17e-8
* Average Gradient (ω<sub>j,j∈[96,192]</sub>, MRL): 0.257
**Line Chart Data (Gradient Variance):**
* **Gradient Variance (ω<sub>k,k∈[0,192]</sub>, SMRL) - Blue Line:**
* Epoch 0: 5.556e-4
* Epoch 10: 2.24e-6
* Epoch 20: 1.64e-7
* Epoch 30: 9.17e-8
The blue line slopes downward.
* **Gradient Variance (ω<sub>k,k∈[0,192]</sub>, MRL) - Brown Line:**
* Epoch 0: 2.11e-4
* Epoch 10: 5.28e-6
* Epoch 20: 8.12e-7
* Epoch 30: 4.99e-7
The brown line slopes downward.
### Key Observations
* The average gradients for both SMRL and MRL models decrease as the number of epochs increases.
* The gradient variance for both SMRL and MRL models also decreases as the number of epochs increases.
* The gradient size is significantly larger for SMRL than MRL.
* The variance is higher for SMRL than MRL at the start, but the difference decreases over time.
### Interpretation
The chart illustrates the training behavior of two models, SMRL and MRL, by tracking the average gradient and gradient variance over epochs. The decreasing gradient size suggests that the models are learning and converging towards a stable solution. The decreasing gradient variance indicates that the models are becoming more consistent in their updates. The SMRL model initially has a larger gradient size and variance compared to the MRL model, but both models show a similar trend of decreasing gradient size and variance over time. This suggests that both models are learning effectively, but the SMRL model might be starting from a different initial state or have a different learning rate.