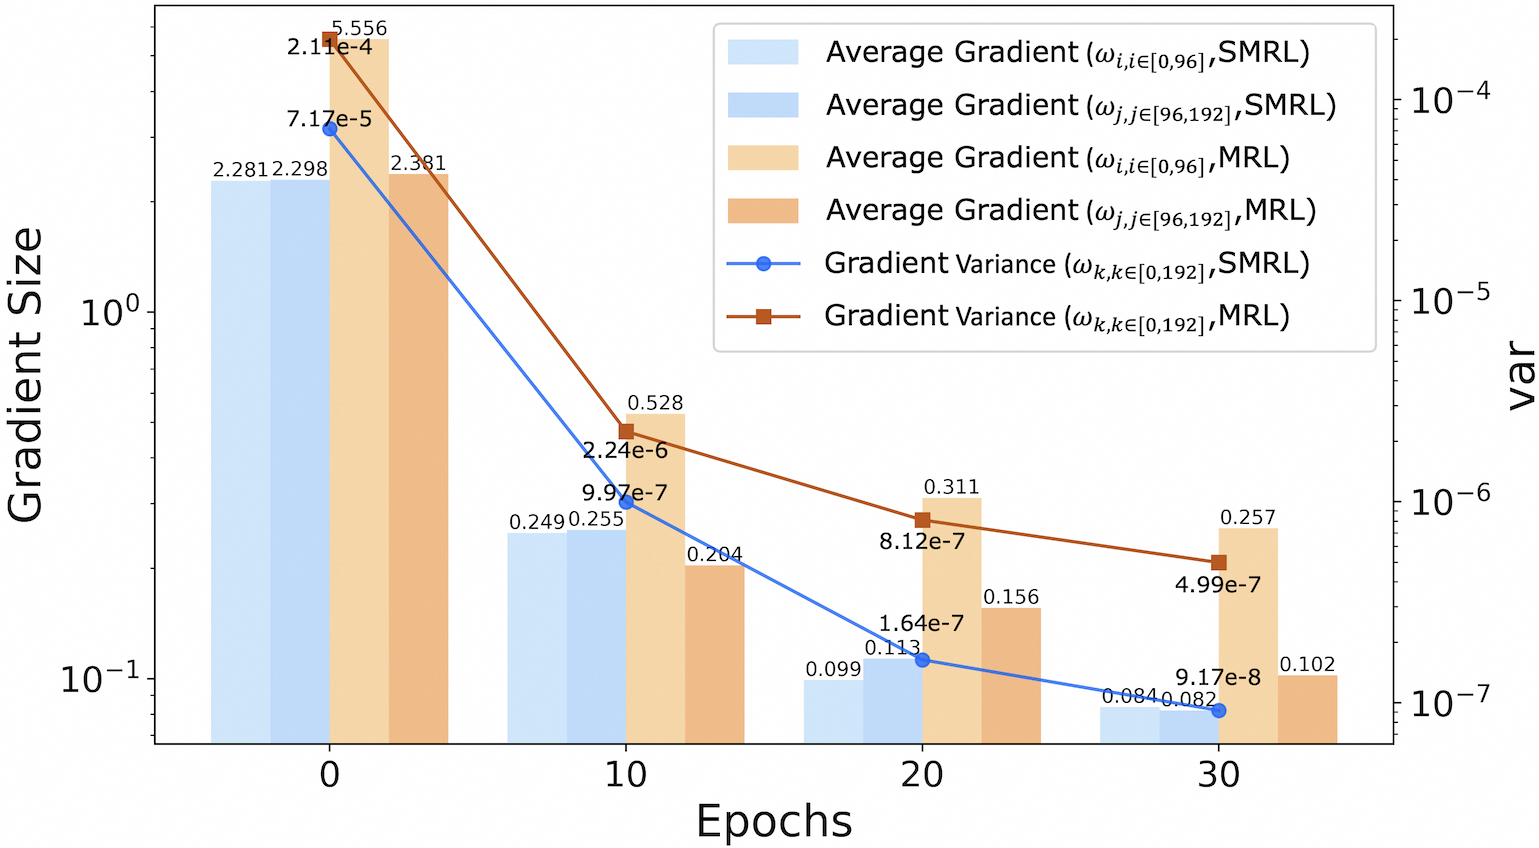
## Bar Chart with Dual Y-Axes: Gradient Size and Variance Across Epochs
### Overview
The chart visualizes the evolution of gradient magnitudes and variances during training epochs for two optimization methods (SMRL and MRL). It uses a logarithmic scale for both y-axes to accommodate wide-ranging values. The left y-axis tracks "Gradient Size" (average gradient magnitudes), while the right y-axis tracks "var" (gradient variance). Data is plotted at four epoch intervals: 0, 10, 20, and 30.
### Components/Axes
- **X-Axis**: Epochs (0, 10, 20, 30)
- **Left Y-Axis**: Gradient Size (log scale: 10⁻¹ to 10¹)
- **Right Y-Axis**: var (log scale: 10⁻⁷ to 10⁻⁴)
- **Legend**:
- Light blue: Average Gradient (ωᵢ,ᵢ∈[0,96], SMRL)
- Blue: Average Gradient (ωⱼ,ⱼ∈[96,192], SMRL)
- Light orange: Average Gradient (ωᵢ,ᵢ∈[0,96], MRL)
- Orange: Average Gradient (ωⱼ,ⱼ∈[96,192], MRL)
- Blue line with circles: Gradient Variance (ωₖ,ₖ∈[0,192], SMRL)
- Red line with squares: Gradient Variance (ωₖ,ₖ∈[0,192], MRL)
### Detailed Analysis
#### Gradient Size (Left Y-Axis)
- **Epoch 0**:
- SMRL (ωᵢ,ᵢ∈[0,96]): 2.281
- SMRL (ωⱼ,ⱼ∈[96,192]): 2.298
- MRL (ωᵢ,ᵢ∈[0,96]): 2.381
- MRL (ωⱼ,ⱼ∈[96,192]): 5.556
- **Epoch 10**:
- SMRL (ωᵢ,ᵢ∈[0,96]): 0.249
- SMRL (ωⱼ,ⱼ∈[96,192]): 0.255
- MRL (ωᵢ,ᵢ∈[0,96]): 0.204
- MRL (ωⱼ,ⱼ∈[96,192]): 0.528
- **Epoch 20**:
- SMRL (ωᵢ,ᵢ∈[0,96]): 0.099
- SMRL (ωⱼ,ⱼ∈[96,192]): 0.113
- MRL (ωᵢ,ᵢ∈[0,96]): 0.156
- MRL (ωⱼ,ⱼ∈[96,192]): 0.311
- **Epoch 30**:
- SMRL (ωᵢ,ᵢ∈[0,96]): 0.084
- SMRL (ωⱼ,ⱼ∈[96,192]): 0.082
- MRL (ωᵢ,ᵢ∈[0,96]): 0.102
- MRL (ωⱼ,ⱼ∈[96,192]): 0.257
#### Gradient Variance (Right Y-Axis)
- **Epoch 0**:
- SMRL: 7.17e-5
- MRL: 2.11e-4
- **Epoch 10**:
- SMRL: 9.97e-7
- MRL: 2.24e-6
- **Epoch 20**:
- SMRL: 1.64e-7
- MRL: 8.12e-7
- **Epoch 30**:
- SMRL: 9.17e-8
- MRL: 4.99e-7
### Key Observations
1. **Gradient Magnitude Trends**:
- All gradient magnitudes decrease monotonically across epochs.
- MRL consistently exhibits larger gradients than SMRL (e.g., MRL ωⱼ,ⱼ∈[96,192] starts at 5.556 vs. SMRL’s 2.298 at epoch 0).
- The largest gradient magnitude (5.556) occurs in MRL’s ωⱼ,ⱼ∈[96,192] at epoch 0.
2. **Variance Trends**:
- Both SMRL and MRL show exponential decay in variance.
- MRL variance remains higher than SMRL at all epochs (e.g., MRL variance at epoch 30: 4.99e-7 vs. SMRL’s 9.17e-8).
- The largest variance (2.11e-4) occurs in MRL at epoch 0.
3. **Divergence Between Methods**:
- MRL’s gradients and variances are systematically larger than SMRL’s, suggesting stronger updates but potentially less stability.
### Interpretation
The data demonstrates that both SMRL and MRL experience diminishing gradient magnitudes and variances as training progresses, indicating convergence toward stable parameter updates. However, MRL maintains consistently higher gradient magnitudes and variances compared to SMRL, implying:
- **Stronger Learning Dynamics**: MRL’s larger gradients may enable faster convergence but at the cost of increased variability.
- **Stability Trade-offs**: SMRL’s lower variances suggest more stable updates, potentially at the expense of slower learning.
- **Epoch-Specific Behavior**: The sharpest declines in gradient size occur between epochs 0–10, while variance reductions are more gradual. This could reflect an initial "explosive" phase of learning followed by refinement.
The logarithmic scaling highlights the exponential decay patterns, emphasizing the importance of monitoring both magnitude and variability in gradient-based optimization.