\n
## Line Chart: Training Performance Metrics
### Overview
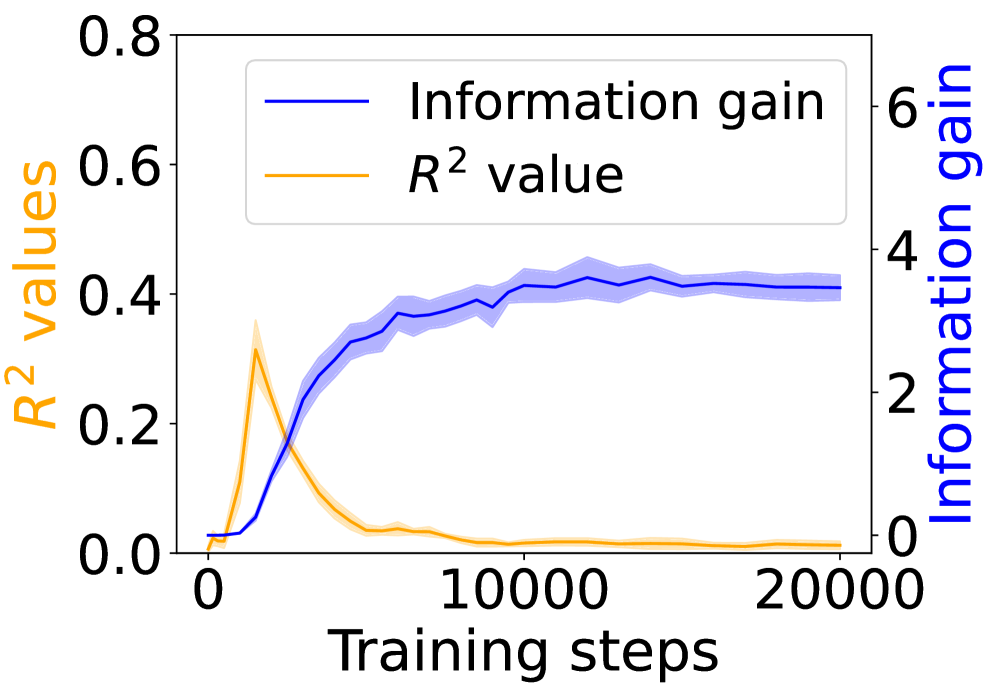
This image presents a line chart illustrating the training performance of a model, tracking both Information Gain and R² value over Training Steps. The chart displays two distinct curves, each with a shaded region representing uncertainty or variance. The chart is designed to show how these metrics evolve during the training process.
### Components/Axes
* **X-axis:** "Training steps" ranging from approximately 0 to 20000.
* **Left Y-axis:** "R² values" ranging from 0 to 0.8.
* **Right Y-axis:** "Information gain" ranging from 0 to 6.
* **Line 1 (Blue):** "Information gain" with a shaded region.
* **Line 2 (Orange):** "R² value" with a shaded region.
* **Legend:** Located in the top-right corner, clearly labeling each line.
### Detailed Analysis
**Information Gain (Blue Line):**
The blue line representing Information Gain starts at approximately 0.5 at 0 training steps and exhibits an upward trend, reaching a peak of around 4.5 at approximately 12000 training steps. After this peak, the line plateaus and fluctuates between approximately 4.0 and 4.3 until 20000 training steps. The shaded region around the line indicates variability, with the lower bound starting around 0.2 at 0 training steps and rising to approximately 3.5 at 12000 steps, then remaining around 3.7-4.0.
**R² Value (Orange Line):**
The orange line representing the R² value begins at approximately 0 at 0 training steps and rapidly increases to a peak of around 0.25 at approximately 5000 training steps. Following this peak, the line declines steadily, reaching a value of approximately 0.05 at 20000 training steps. The shaded region around the line shows variability, starting at approximately 0 at 0 training steps, peaking around 0.3 at 5000 steps, and then decreasing to approximately 0.03 at 20000 steps.
### Key Observations
* Information Gain increases initially and then plateaus, suggesting the model is learning and then reaching a point of diminishing returns.
* R² value increases initially, indicating improved model fit, but then decreases, suggesting overfitting or a loss of generalization ability.
* The shaded regions indicate a degree of uncertainty or variance in the metrics, which is expected during training.
* The two metrics exhibit inverse behavior after approximately 5000 training steps. As Information Gain plateaus, R² value begins to decline.
### Interpretation
The chart suggests a training process where the model initially gains information and improves its fit to the training data (as indicated by the increasing Information Gain and R² value). However, after a certain point (around 5000-12000 training steps), the model appears to start overfitting or losing its ability to generalize, as evidenced by the plateauing Information Gain and decreasing R² value. This could indicate the need for regularization techniques, early stopping, or a more complex model architecture. The inverse relationship between the two metrics after the initial phase is a key observation, suggesting a trade-off between model complexity and generalization ability. The shaded regions highlight the inherent stochasticity of the training process and the potential for variations in performance.