## Bar Chart: Overall Accuracy Comparison
### Overview
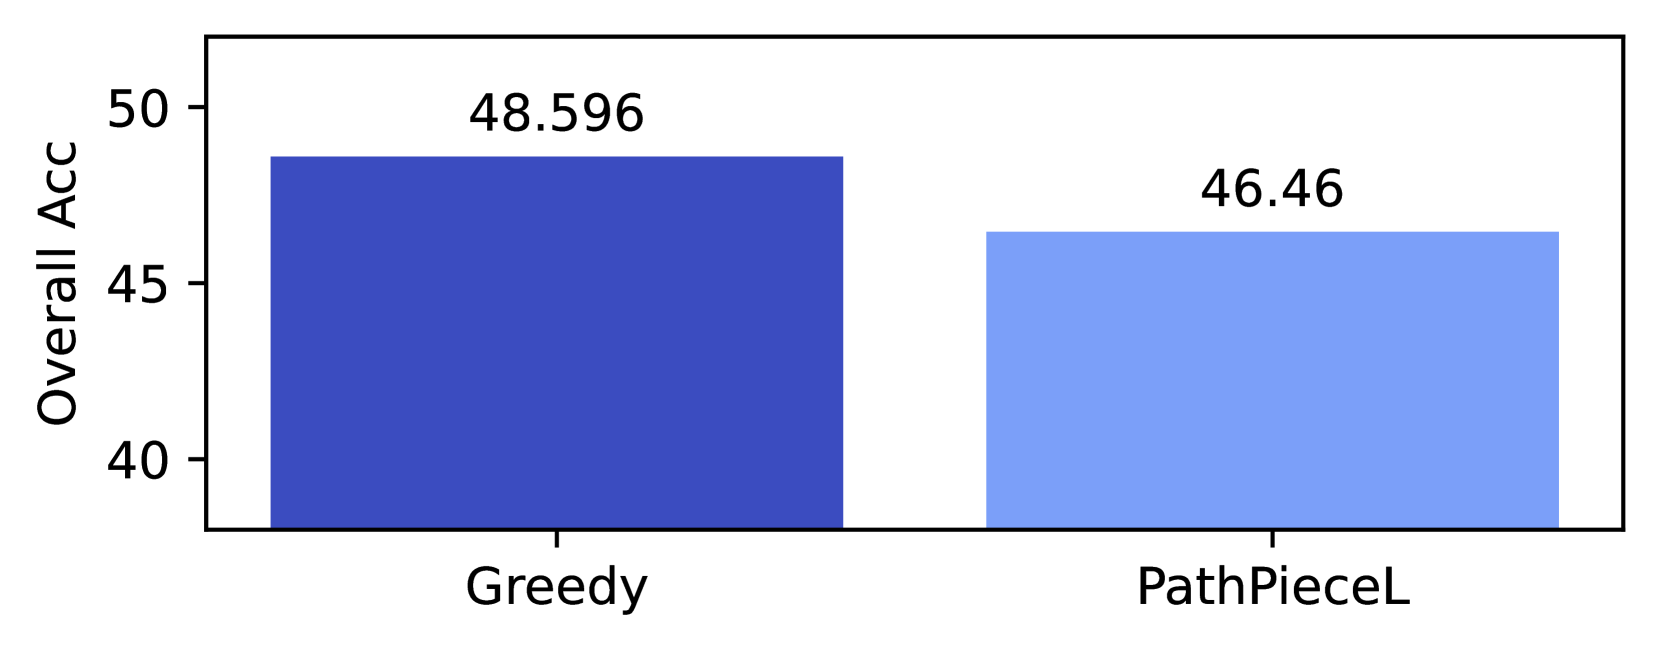
The image is a bar chart comparing the overall accuracy of two methods: "Greedy" and "PathPieceL". The y-axis represents "Overall Acc" (Overall Accuracy), ranging from 40 to 50. The chart displays the accuracy values for each method as bars, with "Greedy" having a higher accuracy than "PathPieceL".
### Components/Axes
* **X-axis:** Categorical axis with two categories: "Greedy" and "PathPieceL".
* **Y-axis:** Numerical axis labeled "Overall Acc", ranging from 40 to 50, with tick marks at 40, 45, and 50.
* **Bars:** Two bars representing the accuracy of each method. The "Greedy" bar is dark blue, and the "PathPieceL" bar is light blue.
* **Values:** Numerical values are displayed above each bar, indicating the exact accuracy.
### Detailed Analysis
* **Greedy:** The dark blue bar for "Greedy" reaches an accuracy of 48.596.
* **PathPieceL:** The light blue bar for "PathPieceL" reaches an accuracy of 46.46.
### Key Observations
* The "Greedy" method has a higher overall accuracy compared to the "PathPieceL" method.
* The difference in accuracy between the two methods is approximately 2.136 (48.596 - 46.46).
### Interpretation
The bar chart visually demonstrates that the "Greedy" method performs better in terms of overall accuracy than the "PathPieceL" method. The difference in accuracy, approximately 2.136, suggests that the "Greedy" approach is more effective in this particular context. This information is valuable for selecting the appropriate method based on the desired level of accuracy.