\n
## Diagram: Agent Evolution
### Overview
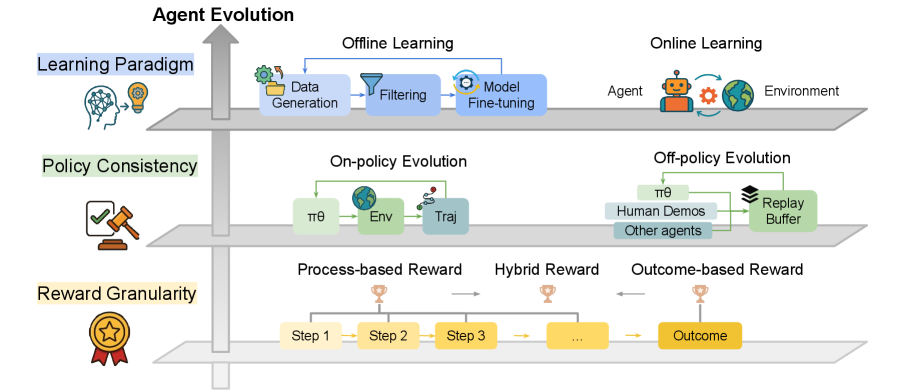
This diagram illustrates the different facets of Agent Evolution in a reinforcement learning context. It categorizes evolution based on Learning Paradigm, Policy Consistency, and Reward Granularity, showing how these aspects relate to Offline Learning, Online Learning, On-policy Evolution, Off-policy Evolution, and different reward structures. The diagram uses icons and arrows to represent processes and relationships.
### Components/Axes
The diagram is structured around three main axes:
* **Learning Paradigm:** Located on the left, with an icon of a brain with a lightbulb.
* **Policy Consistency:** Positioned centrally-left, with an icon of a gavel and checklist.
* **Reward Granularity:** Located centrally-bottom, with an icon of a star and medal.
The diagram then branches out into:
* **Offline Learning:** A process flow with "Data Generation", "Filtering", and "Model Fine-tuning" steps.
* **Online Learning:** Depicts an "Agent" interacting with an "Environment".
* **On-policy Evolution:** Shows a process involving "πθ", "Env", and "Traj".
* **Off-policy Evolution:** Shows a process involving "πθ", "Human Demos", "Other agents", and a "Replay Buffer".
* **Process-based Reward:** A sequence of "Step 1", "Step 2", "Step 3", and so on.
* **Hybrid Reward:** A combination of process steps leading to a reward.
* **Outcome-based Reward:** A direct link from an "Outcome" to a reward.
### Detailed Analysis or Content Details
The diagram doesn't contain numerical data, but describes processes. Here's a breakdown of the components:
* **Learning Paradigm:** This axis distinguishes between Offline Learning and Online Learning. Offline learning involves processing existing data, while Online Learning involves real-time interaction.
* **Offline Learning:** The process starts with "Data Generation", followed by "Filtering" to refine the data, and concludes with "Model Fine-tuning". The flow is indicated by curved arrows.
* **Online Learning:** An "Agent" interacts with an "Environment". This is a simple depiction of the agent-environment loop.
* **Policy Consistency:** This axis splits into "On-policy Evolution" and "Off-policy Evolution".
* **On-policy Evolution:** Involves "πθ" (policy with parameters θ), "Env" (environment), and "Traj" (trajectory).
* **Off-policy Evolution:** Uses data from "Human Demos", "Other agents", and stores experiences in a "Replay Buffer".
* **Reward Granularity:** This axis shows three types of rewards:
* **Process-based Reward:** Rewards are given at each "Step" (Step 1, Step 2, Step 3, etc.). The steps are connected by dashed lines.
* **Hybrid Reward:** Combines process steps with a reward.
* **Outcome-based Reward:** Rewards are given based on the final "Outcome".
### Key Observations
The diagram highlights the different approaches to agent evolution. It emphasizes the trade-offs between learning from existing data (offline) versus real-time interaction (online), and the importance of considering policy consistency and reward structure. The diagram is visually organized to show how these different aspects intersect and influence each other.
### Interpretation
The diagram presents a conceptual framework for understanding the complexities of agent evolution in reinforcement learning. It suggests that there isn't a single "best" approach, but rather a spectrum of possibilities depending on the specific application and constraints. The diagram emphasizes the importance of carefully considering the learning paradigm, policy consistency, and reward granularity when designing an agent. The branching structure indicates that these factors are not mutually exclusive and can be combined in various ways. The use of icons and visual flow makes the diagram accessible and easy to understand, even for those not deeply familiar with reinforcement learning. The diagram is a high-level overview and doesn't delve into the technical details of each approach. It serves as a useful starting point for further exploration and research.